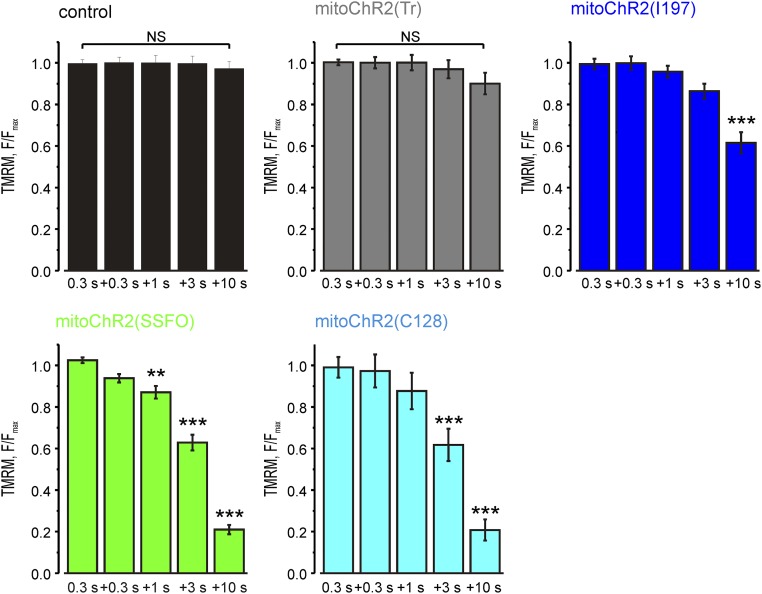
Fig. S2.
Quantification of the membrane potential signal changes elicited by light illumination (as marked) in cells expressing the indicated constructs (see representative traces in Fig. 3A); n > 17 cells for each condition. Data are presented as mean ± SEM. **P < 0.01, ***P < 0.001. NS, not significant.

