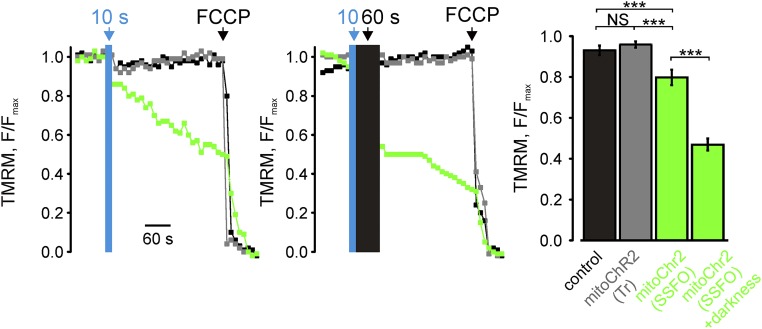
Fig. S6.
Effect of TMRM excitation on mitoChR2(SSFO) opening kinetics. Representative kinetics of Δψm changes in single HeLa cells expressing mitoChR2(SSFO)-YFP (green trace), mitoChR2(Tr)-YFP (gray trace), or empty vector (coexpressing a mitochondrial YFP; black trace). Where indicated, cells were illuminated with a single 10-s blue light pulse of 2 mW/mm2 (Left) or a single 10-s blue light pulse followed by 60 s of darkness (Middle). The bar graph shows mean F/Fmax changes (±SEM; n ≥ 16 per condition), calculated 1 min after blue light photoactivation (Right). ***P < 0.001. NS, not significant.

