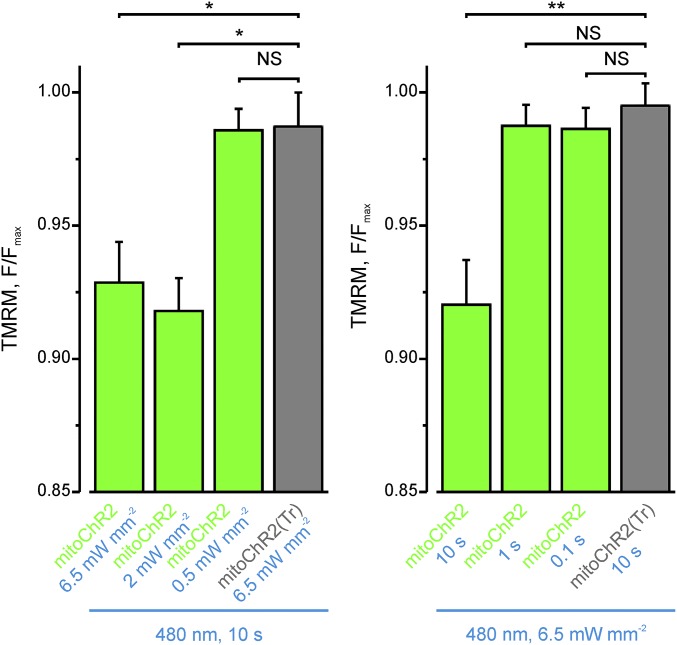
Fig. S7.
Light intensity and time dependence of Δψm changes in single HEK293T cells expressing mitoChR2 as in Fig. 4C. (Left) Light intensity dependence of the indicated mean TMRM F/Fmax values in mitoChR2(Tr)- (gray bar) and mitoChR2-YFP–expressing cells (green bars); n ≥ 28 cells per condition. (Right) Light time dependence of the indicated mean ± SEM TMRM F/Fmax values in mitoChR2(Tr)- (gray bar) and mitoChR2-YFP–expressing cells (green bars); n ≥ 85 cells per condition. *P < 0.05, **P < 0.01. NS, not significant.

