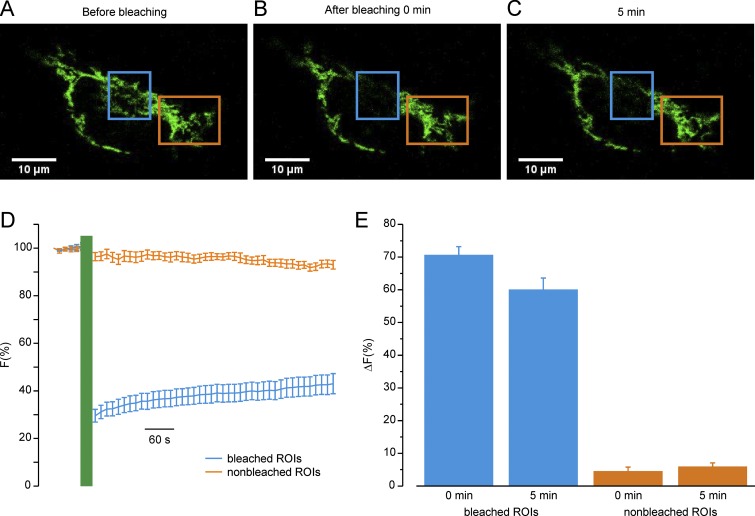
Fig. S10.
FRAP analysis of mitochondrial network dynamics. (A–C) Representative confocal images of HeLa cells expressing mito-YFP before photobleaching (A), immediately after (B), and 5 min after (C) photobleaching in different regions of interest (ROIs). The blue ROI indicates the bleached area; the orange ROI indicates a nonbleached area. (Scale bars, 10 μm.) (D) Mean ± SEM traces of Mito-YFP fluorescence intensity. Traces show fluorescence intensities before and after photobleaching normalized to prebleached ones and plotted over time. The blue trace refers to bleached ROIs; the orange trace refers to ROIs of a nonbleached area. (E) Bars represent mean ± SEM values of the ΔF(%) changes (calculated as the difference between the fluorescence before bleaching and the fluorescence immediately or 5 min after bleaching) of the indicated ROIs at two different time points: immediately (0 min) and 5 min after bleaching. n = 12 cells per condition. P < 0.05 between the recovery of bleached and nonbleached regions.

