Fig. 6.
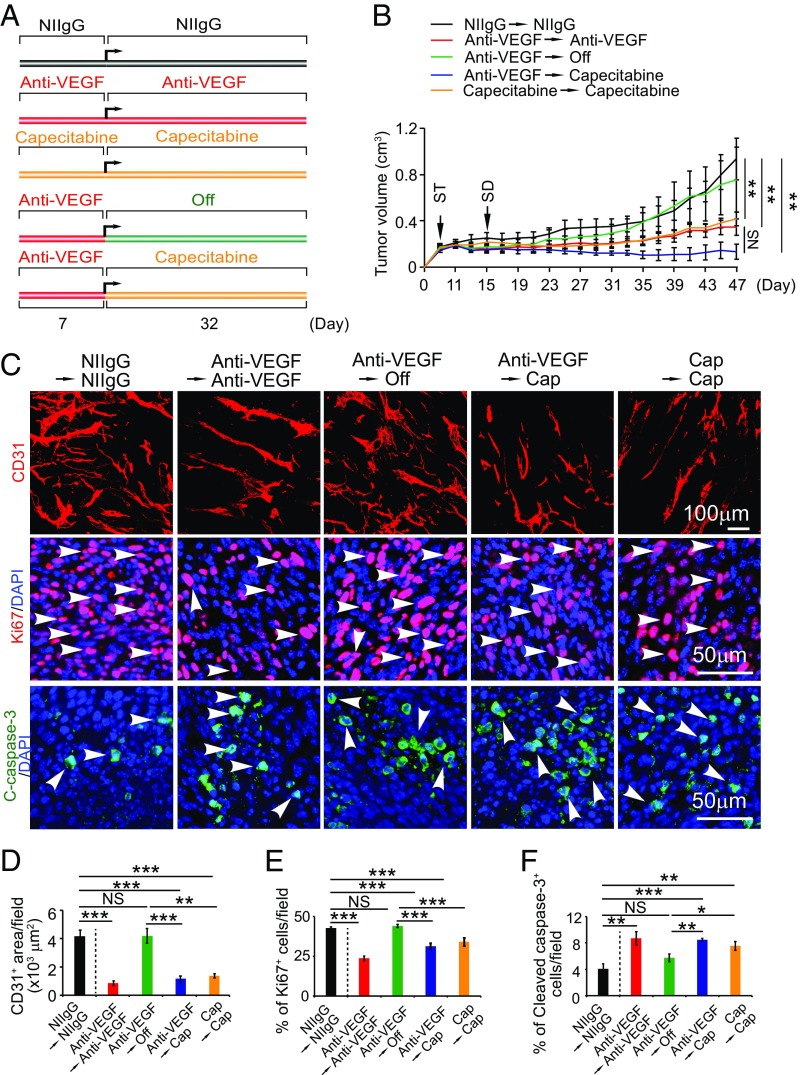
Antiangiogenic and antitumor maintenance therapy with an extremely low dose of capecitabine. (A) Sequential treatment schedule. (B) Growth rates of continuous NIIgG-treated, continuous VEGF blockade-treated, continuous capecitabine-treated, VEGF blockade and cessation-treated, and VEGF blockade switching to low-dose capecitabine-treated MC38 colorectal cancers (n = 6–7 mice per group). ST: starting treatment; SD: switching drug. (C) Representative histological images of CD31+ blood vessels, Ki67+ proliferating cells, and cleaved caspase-3+ apoptotic cells. Arrowheads point to proliferating (red signal) and apoptotic (green signal) cells. (D–F) Quantifications of CD31+ blood vessels, Ki67+ proliferating cells, and cleaved caspase-3+ apoptotic cells in various agent-treated tumors (n = 6–8 random fields per group). Data are means ± SEM. *P < 0.05; **P < 0.01; ***P < 0.001. NS, not significant.

