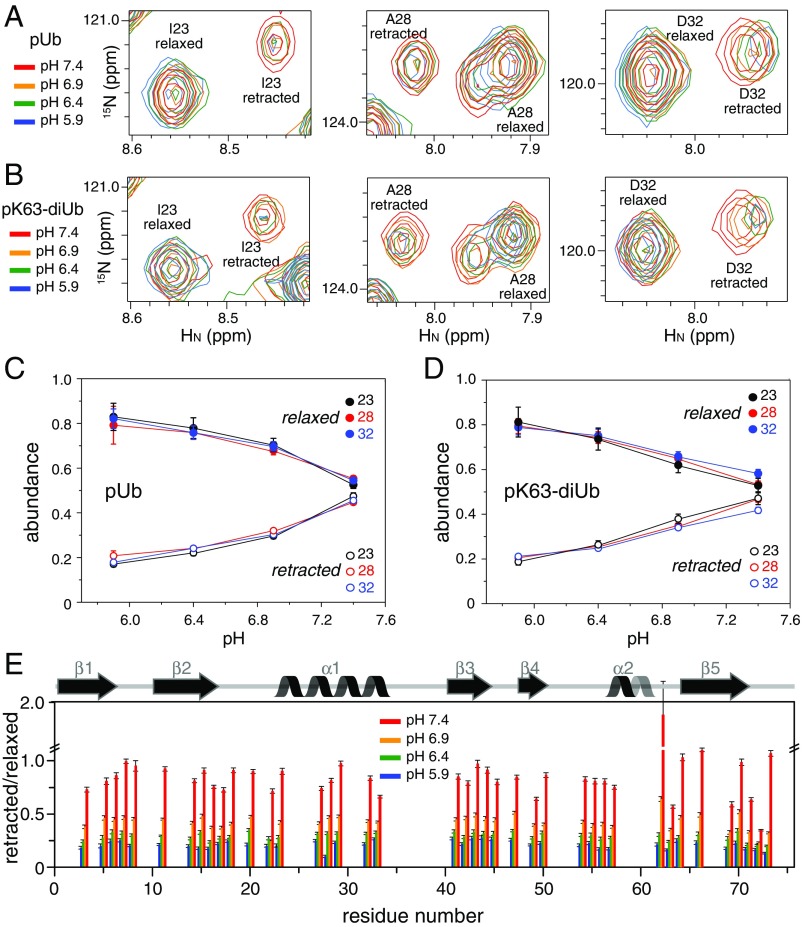
Fig. 2.
Changes of NMR peak intensities in response to pH. (A and B) Overlay of 15N-HSQC spectra for residues I23, A28, and D32 in pUb and the proximal Ub of pK63-diUb, respectively. The data were collected at 298 K with the proteins prepared in 20 mM Pipes buffer containing 150 mM NaCl. These residues are far from pS65, and experience relatively little chemical-shift perturbations upon pH change. (C and D) The abundance of the relaxed or retracted state, roughly proportional to the peak intensities, is plotted as a function of pH. (E) Relative peak intensity for all of the residues in pUb. Only the peaks that can be quantified for both states in all pH conditions are shown. Error bars indicate the SD propagated from the peak-intensity measurements. The secondary structures of pUb are indicated.

