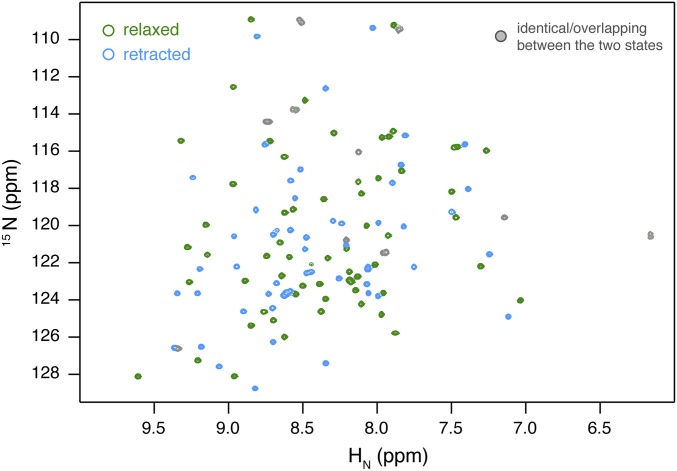
Fig. S1.
1H-15N HSQC spectrum for pUb collected at pH 7.4 in 20 mM Hepes buffer containing 150 mM NaCl. Many more peaks are observed than the number of residues in ubiquitin, a 76-residue protein. The peaks arise from two species at about equal populations, namely the relaxed state (green contours) and the retracted state (cyan contours). The two species interconvert at a slow timescale relative to their chemical-shift differences, as previously shown (13). There are a total of 125 peaks in the spectrum, among which 59 peaks can be uniquely identified for the backbone amide of the relaxed state and 56 peaks can be uniquely identified for the backbone amide of the retracted state. In addition, there are 10 peaks that can be assigned to a particular residue of either conformational state due to spectral overlap (gray contours). The 10 residues are 10, 25, 34, 35, 36, 39, 52, 60, 61, and 67.

