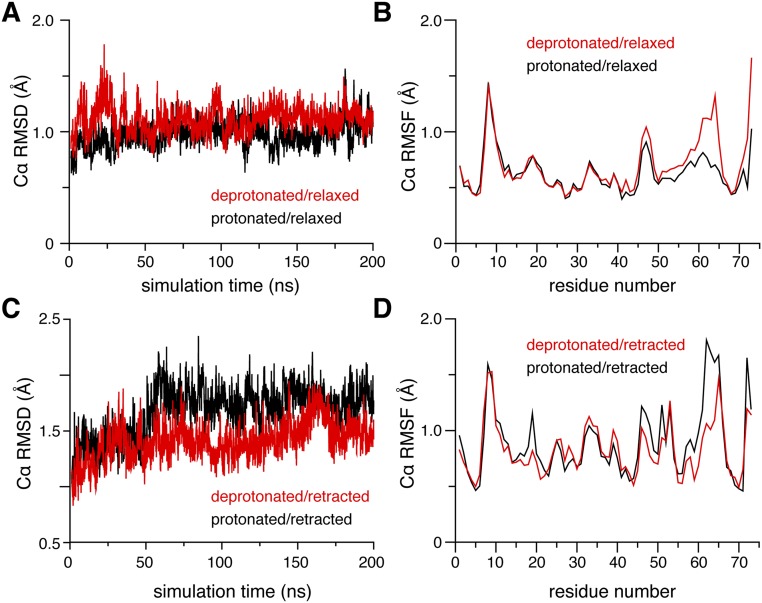
Fig. S7.
Molecular dynamics simulations starting from pUb structures. (A and C) Representative trajectories for the pUb relaxed state and retracted state, respectively. Fluctuations in Cα RMSD are shown for residues 1 to 72 for the relaxed state and 1 to 74 for the retracted state. (B and D) The Cα RMSFs calculated with reference to the average conformation of the relaxed and retracted state, respectively.

