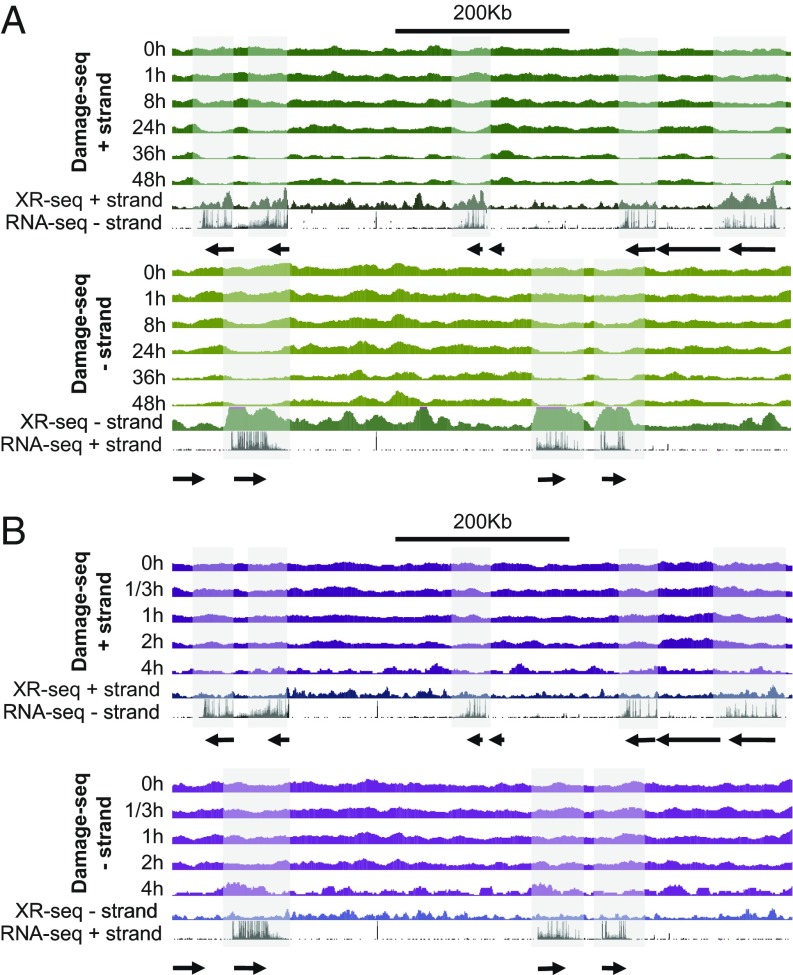
Fig. 3.
Patterns of damage distribution as a function of time. (A) CPD and (B) (6-4)PP damage distribution within a ∼0.9-Mb region of chromosome 9 (100,137,675–101,036,695). For each panel, Top shows the Damage-seq of different time points and initial XR-seq. [1 h for CPD and 5 min for (6-4)PP] reads mapped onto the plus strand and relevant RNA-seq reads mapped on the minus strand. Bottom represents the complementary strands. The shadows highlight transcribed genes on each strand.

