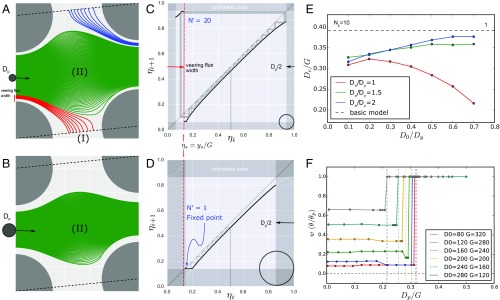
Fig. 5.
The trajectory of particles with different diameters and corresponding recurrence maps. (A and B) Particle trajectories inside a unit cell with different particle diameters. Here, the particle diameters are , respectively, and , and . A black circle represents the particle with a given radius. (C and D) Corresponding recurrence maps for a particle starting at the midpoint (). The dark gray regions represent a forbidden region by the particle–wall interaction as directional locking. The black circle shows the particle radius with a scale of gap size. (E) The critical diameter dependence on the pillar geometry (). (F) The effect of DLD array geometry on the transition from altered zigzag to bumping mode. The plot shows the normalized migration angle as a function of particle size for different pillar diameter (). The simulated particle diameters range from 1 to 110 nm, and the pillar diameters are . The dotted lines represent the critical diameter calculated from E.

