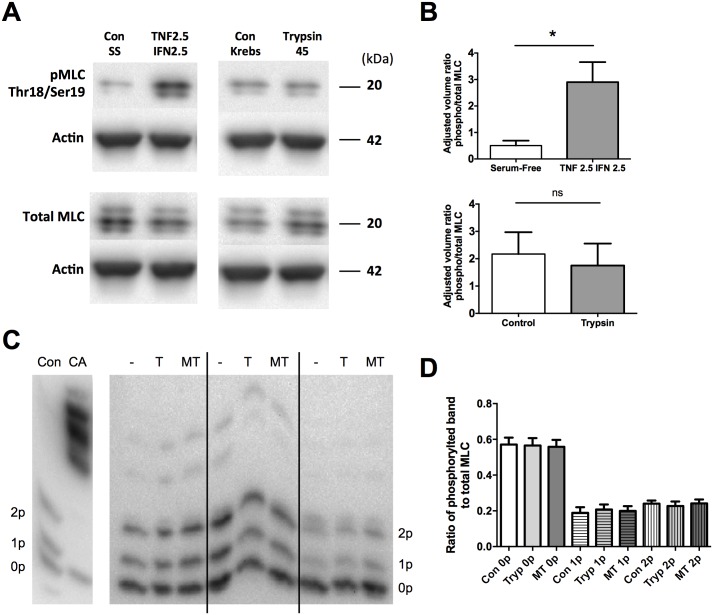
Fig 11. Serine proteases do not induce an increase in phosphorylation of myosin regulatory light chain.
Phosphorylation of MLC was assessed using phospho-specific antibodies (Ser19/Thr18) and western blotting A. A representative blot of phosphorylated and total MLC. B. Densitometry was performed with normalization to actin and the ratios of phosphorylated to total MLC were determined. n = 3–4; ns, not significant compared to control as analyzed by ANOVA with Dunnett’s posthoc test. C. MLC phosphorylation was also determined by Phos-tag gels. SCBN cells were plated on transwells and treated for 15 minutes apically in Krebs with 135 BAU/mL trypsin (T) or 1.5 BAU/mL matriptase (MT). Lysate was collected and phosphorylation of MLC assessed by Phos-tag gel electrophoresis. Protein with zero, one, or two phosphorylations (0p, 1p, 2p) are labeled. The positive control is SCBN cells treated with 3 μM of the phosphatase inhibitor calyculin A (CA) apically for 30 minutes. A blot with n = 3 is shown in C, while densitometry is shown in D and is the ratio of the phosphorylated band over the total MLC (all three bands combined), n = 6. No significant differences are seen as assed by ANOVA within each phosphorylated group.

