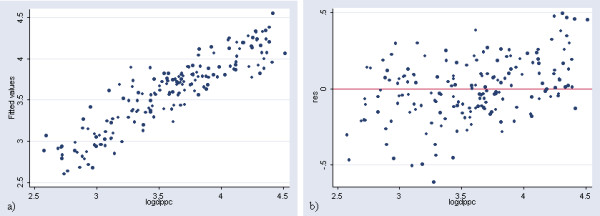
Figure 2.

Prediction of income per capita at the country level (in log). a) Plot of the observed log of GDP per capita versus the predicted ones obtained with the regression in Table 2 b) Plot presenting the residuals versus the log of GDP per capita for the same regression
