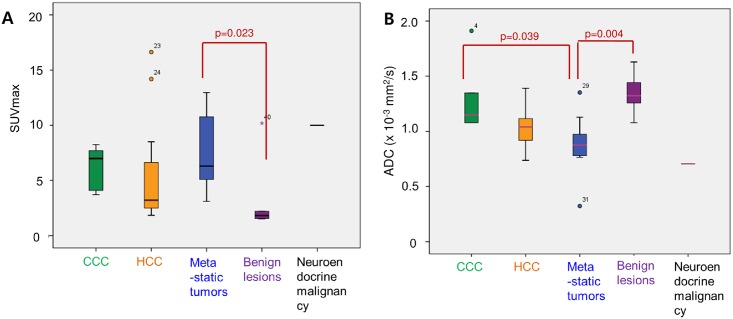
Fig 3. Box plots of SUVmax and ADC values of 41 hepatic tumors.
(A) Distribution of SUVmax in various types of hepatic tumors. SUVmax is higher in metastatic tumors than in benign lesions (p = 0.023). (B) Distribution of ADC in various types of hepatic tumors. Metastatic tumor shows lower ADC than benign lesions (p = 0.004) and CCC (p = 0.039). Each box plot shows median (thick lines), quartiles (upper and lower box boundaries), and extreme values (whiskers) within a category. ADC, apparent diffusion coefficient; CCC, cholangiocarcinoma; HCC, hepatocellular carcinoma.

