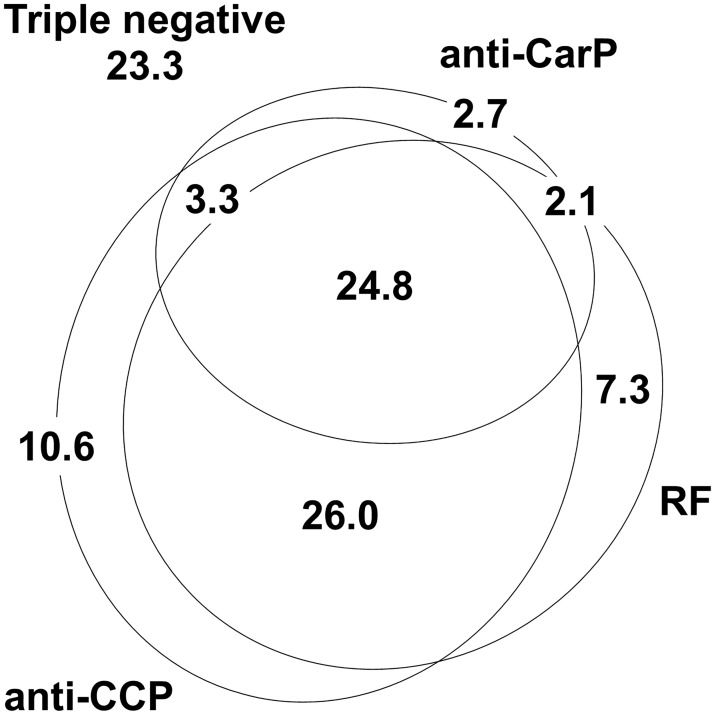
Fig 1. Distribution of patients with RA positive for the different autoantibodies.
A proportional Venn diagram representing percentages (%) of patients in each of the antibody strata: anti-CCP positive in the lower left oval, RF positive in the lower right oval and anti-CarP positive in the upper one. Percentage of triple negatives is shown outside the Venn diagram in the upper left corner.

