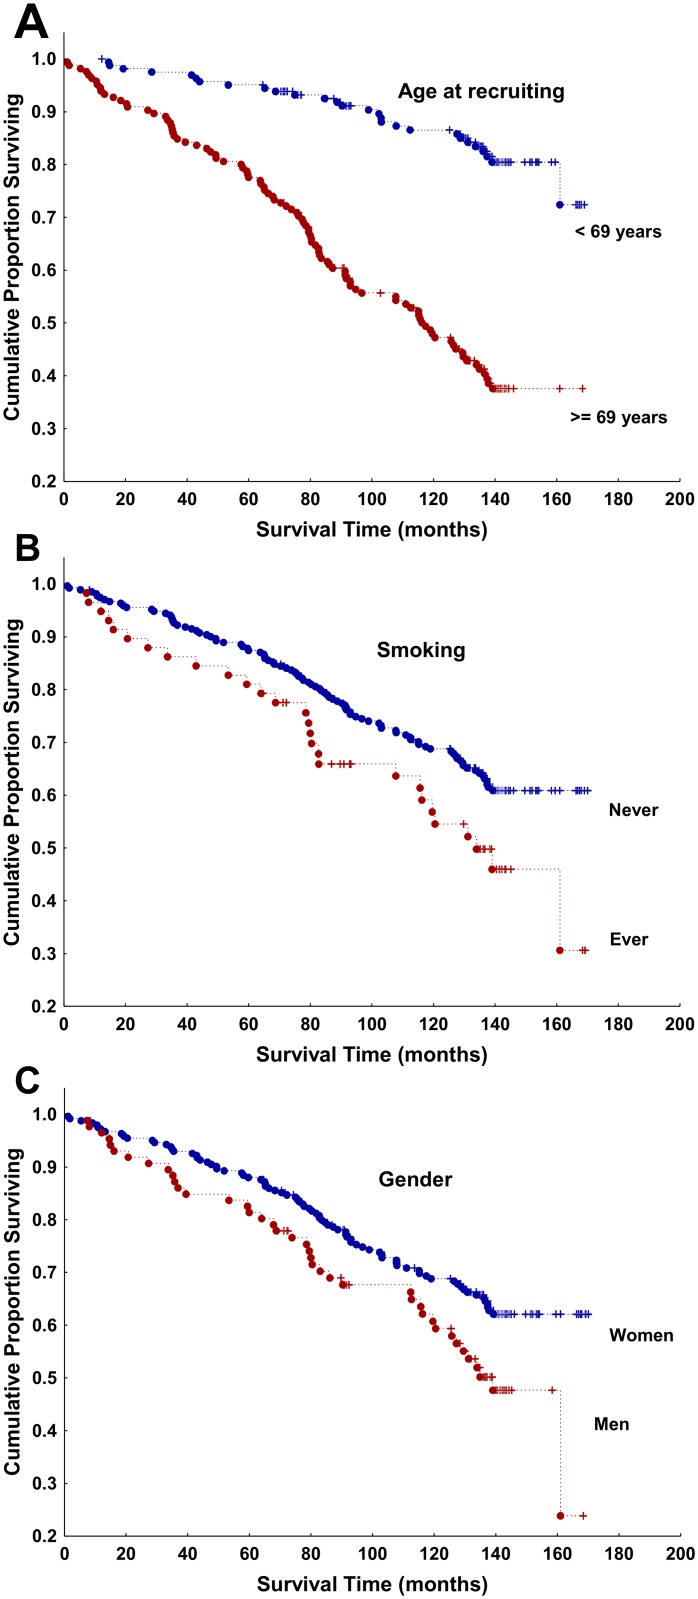
Fig 2. Kaplan-Meier survival curves of all patients with RA stratified by demographic factors.
(A) Stratified by age in relation with the median age at the time of recruitment (red ≥ 69 years, blue < 69 years); (B) stratified by smoking habit (red = ever smoker, blue = never smoker), and (C) stratified by gender (red = men, blue = women). Dots = deaths, crosses = censored data.

