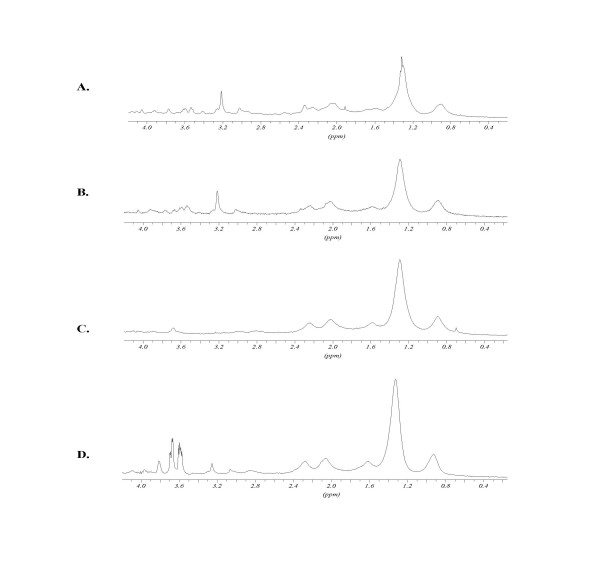
Figure 4.
K562wt 1H-NMR spectra: effects of Triton X-100 and sphingomyelinase treatments. A: non-treated cells; B: cells fixed with PFA; C: cells fixed with PFA 4% in triton-X100 1%; D: cells fixed with PFA 4% incubated in triton-X100 1% and with 0.5 units sphingomyelinase. For peak assignment, see figure 4. Peaks at 3.6 ppm after SMase treatment arise from enzyme working buffer.

