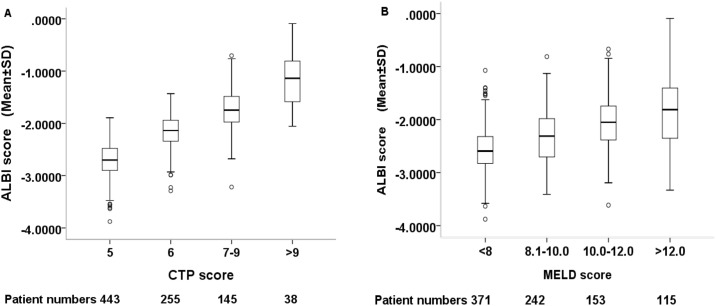
Fig 3. Correlation between ALBI score with CTP score and MELD score.
The ALBI score increases with increasing CTP and MELD scores. The dark line in the middle of the boxes is the median of ALBI score. The bottom of the box indicates the 25th percentile and the top of the box represents the 75th percentile. T-bar at the top and bottom of the box is maximum and minimum values, respectively. ○ indicates extreme values. SD; standard deviation.

