
Figure 8.
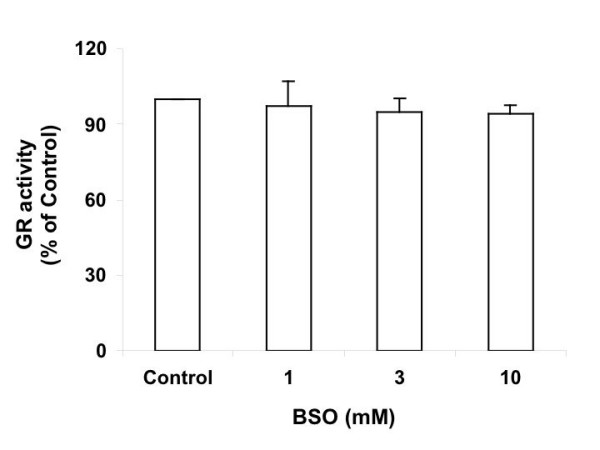
GR activity of Ht22 cells treated with BSO for 15 hours. Average value and SD are shown, N = 3. At 10 mM BSO concentration, the decrease is significant (P = 0.045) vs control.
Official websites use .gov
A
.gov website belongs to an official
government organization in the United States.
Secure .gov websites use HTTPS
A lock (
) or https:// means you've safely
connected to the .gov website. Share sensitive
information only on official, secure websites.
GR activity of Ht22 cells treated with BSO for 15 hours. Average value and SD are shown, N = 3. At 10 mM BSO concentration, the decrease is significant (P = 0.045) vs control.