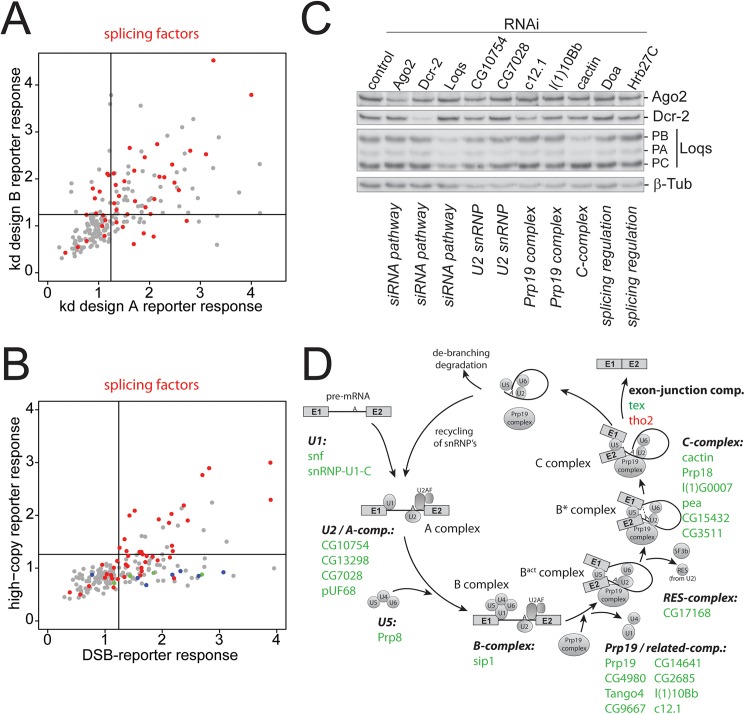
Fig 2. Analysis of splicing factors recovered in the screen.
(A) All factors with the GO-term annotation “splicing” were labeled in red in the context of the validation dataset. These factors had a similar distribution with respect to effect strength and validation success as other candidates. (B) Direct comparison of the effect strength obtained with splicing factors on DNA DSB induced siRNAs (abscissa) and high-copy transgene induced siRNAs (ordinate). Splicing factors are marked in red, while DNA repair factors and RfC components (see Fig 1) are marked in green and blue, respectively. The full dataset is contained in S1 Table. (C) Western Blot analysis to determine whether knock-down of splicing factors leads to impaired expression of core RNAi components. The knock-down is indicated above each lane, the monoclonal antibody used for detection is indicated on the right. All RNAi antibodies were kind gifts of Dr. Mikiko Siomi, the β-tubulin loading control was obtained from the developmental studies hybridoma bank. (D) A map of all spliceosome components identified in the screen onto the various complexes that assemble along the course of a splicing reaction. See also S3 Fig for more detail.

