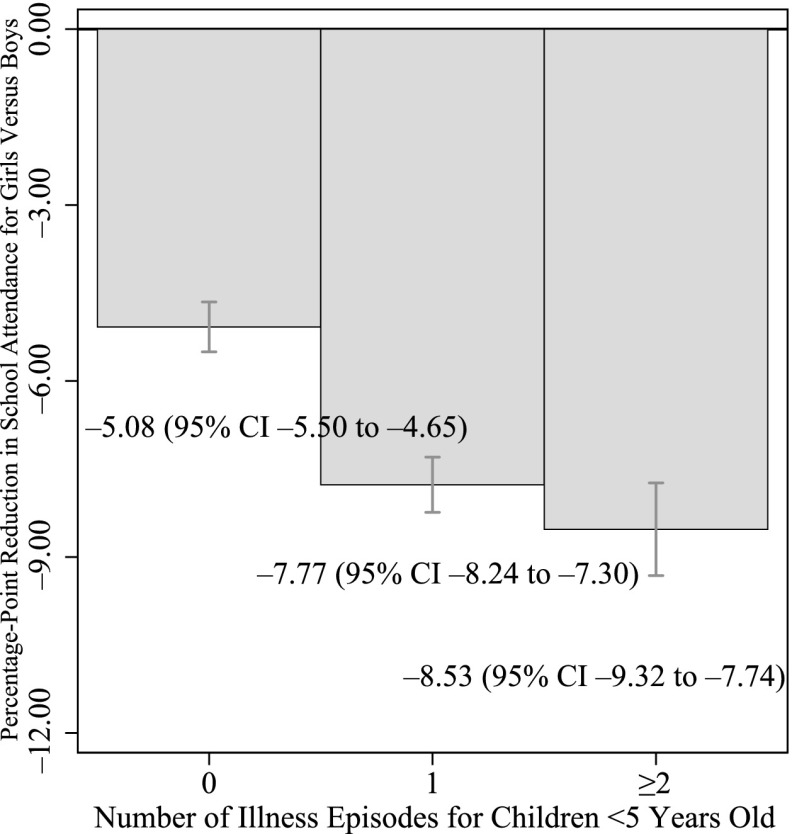
FIGURE 2.
The gender gap in education of older siblings as a function of illness episodes of children <5 years old in the household. The average marginal effect (eg, percentage point reduction in school attendance for girls versus boys) and a 95% CI are shown on the graph. The leftmost column depicts and reports the effect of a gender gap in education if there were no children <5 years old with illness episodes in the last 2 weeks reported by the household. The middle column depicts the same for households that have 1 illness episode in the preceding 2 weeks, and the rightmost column presents the estimate for those households with ≥2 illness episodes.

