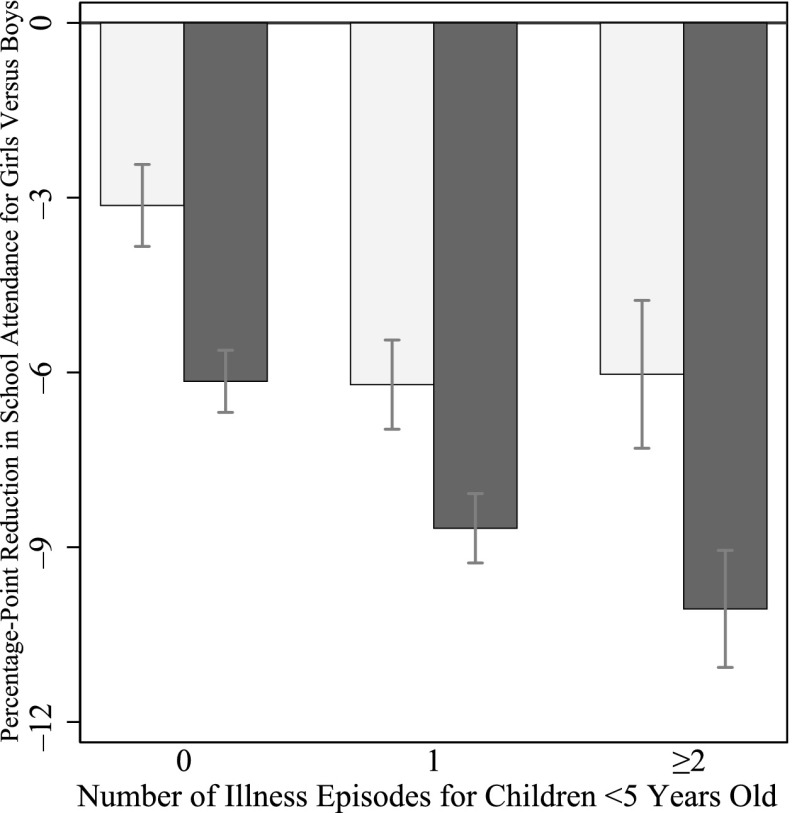
FIGURE 3.
The gender gap in education of older siblings as a function of illness episodes of children <5 years old in the household by maternal labor force participation. The figure depicts the gender gap in education as a function of children <5 years old with illness. The dark bars represent the results of the average marginal effect for households whose mothers work outside the home, and the lighter bars represent the effect for mothers who do not work outside the home. The leftmost column depicts and reports the effect of a gender gap in education if there were no children <5 years old with illness episodes in the last 2 weeks reported by the household. The middle column depicts the same for households that have 1 illness episode in the preceding 2 weeks, and the rightmost column presents the estimate for those households with ≥2 illness episodes.

