
Figure 4. In vivo experimental model to program the fundamentals of orthodontic tooth movement to investigate the “intelligence” of the PDL-bone and PDL-cementum interfaces within the bone-PDL-tooth complex.
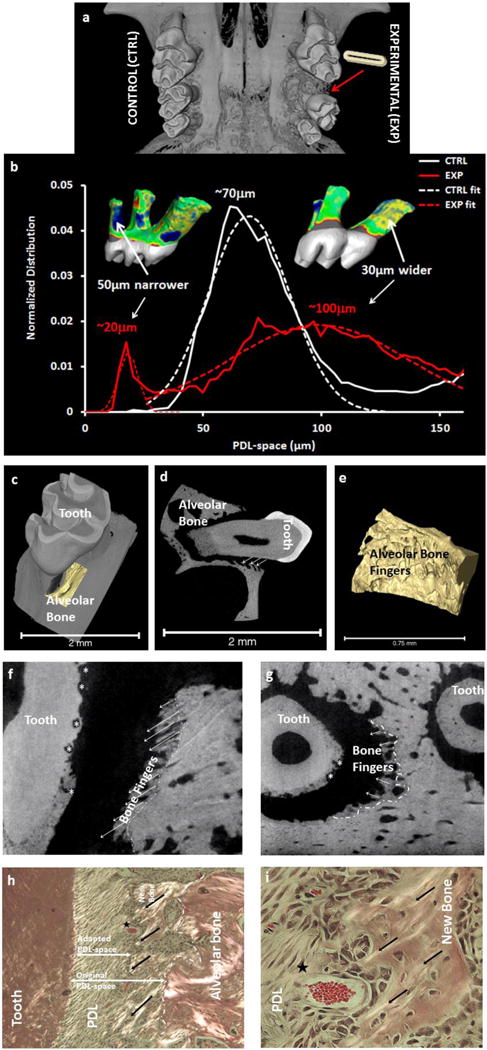
Measured physical changes by comparing the experimental (shows the location and tooth movement due to elastic placement) with control (a) illustrated a homogenous distribution with a peak at 70 μm compared to narrowed (indicated in blue) and widened (indicated in yellow) regions of the PDL-space. The widened PDL-space contributed to bone growth along the strained PDL fibers (b-d, highlighted 3D volume (c, e) and located by arrows in 2D (d) spatial domains). Note the resorption pits in and through cementum invading dentin (asterisks) in longitudinal (f) and transverse (g) directions. Polarized light microscopy on these sections illustrate strained PDL fibers (black arrows) and micro-vessels (star) within regions closer to PDL-bone attachment (g) including hypertrophic cells at the attachment sites (h) compared to polarized cells within PDL perse (g, h). Note the differences between original and adapted PDL-spaces (dashed line demarcates original and newly formed bone. Matrix structure is used as a cue to demarcate original PDL-bone attachment site from adapted) as mineral forms on the strained PDL-fibers.