. 2017 Jul 3;6:e25224. doi: 10.7554/eLife.25224

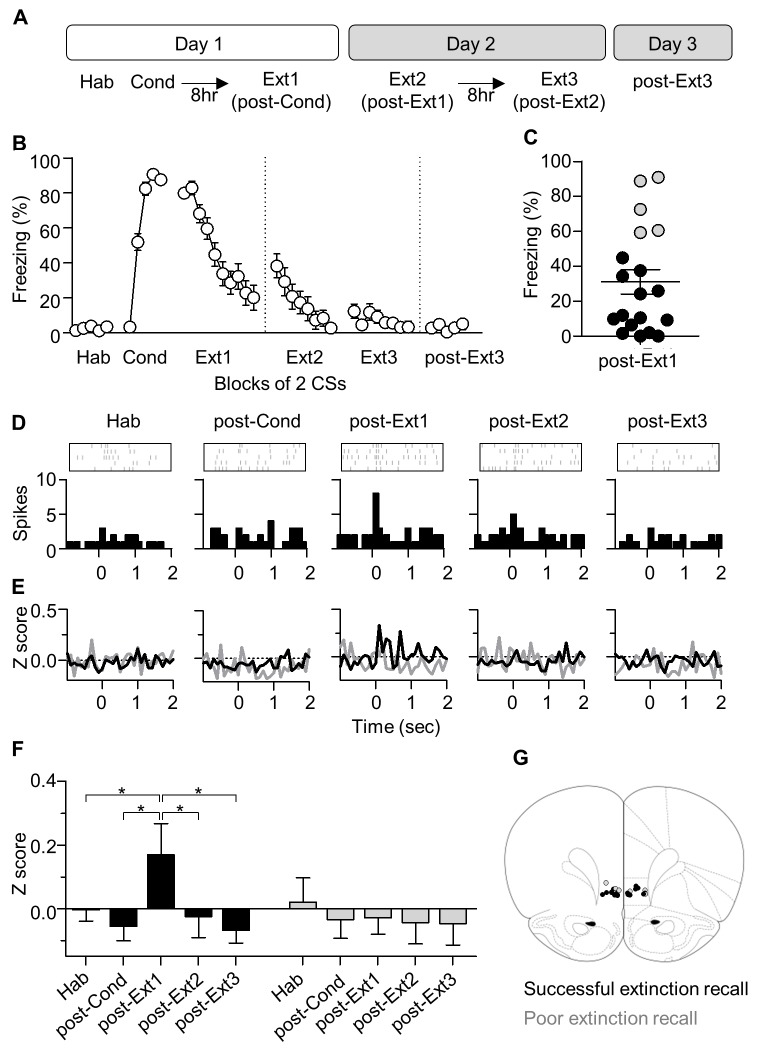
Figure 1. CS-evoked activities of IL neurons appear after single-session extinction-training, but disappear after multiple-session extinction-training.

(A) Experimental design. Hab, habituation; Cond, conditioning; Ext, extinction. (B) CS-induced freezing during conditioning and repeated extinction sessions (n = 19 rats). (C) Rats were divided into two groups according to the percent of time spent freezing in post-Ext1. Successful extinction recall, n = 14 rats, black circle; poor extinction recall, n = 5 rats, gray circle. (D) CS-evoked activities of an example IL neuron. X = 0 indicates the time of tone onset. (E–F) Averaged CS-evoked activities of IL neurons in the successful and poor extinction recall groups. ANOVA revealed a significant change only in the successful extinction recall group (F), for successful extinction recall group, n = 56 cells from 14 rats, F4,220 = 3.346, p=0.0319, *p<0.05 for post-Ext1 vs. the other groups, repeated measures one-way ANOVA followed by Newman-Keuls post-test; for poor extinction recall group, n = 16 cells from 5 rats, F4,60 = 0.2742, p=0.7918]. (G) Histological verification of the electrode placements.25224.

DOI: http://dx.doi.org/10.7554/eLife.25224.002

Figure 1.

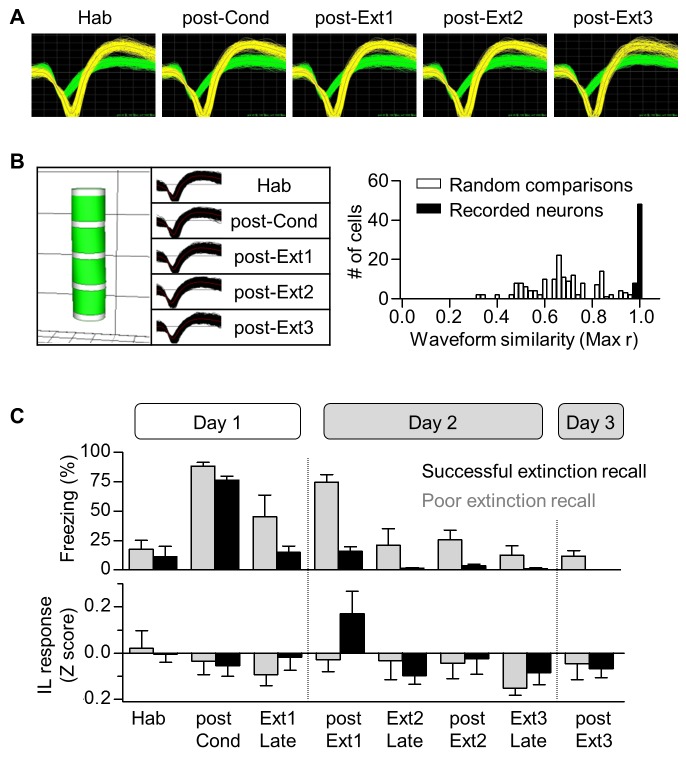
Figure 1—figure supplement 1. Long-term single unit recordings in the IL.

Figure 1—figure supplement 1.

(A) Representative waveforms of two neurons recorded from a single electrode and observed throughout the behavioral training period. Grid, 55 μV x 100 μs. (B) Verification of long-term stable single unit recordings using principal component space cylinders (Left) and the linear correlation analysis between the template waveforms obtained over the entire set of behavioral sessions (Right). A straight cylinder and higher correlation value suggest the same set of single units was recorded during consecutive behavioral sessions. (C) CS-evoked freezing and IL neural responses for the successful (black) and poor (gray) extinction recall groups. The behavioral and neural responses were averaged for the first 5 CSs or the last 5 CSs.
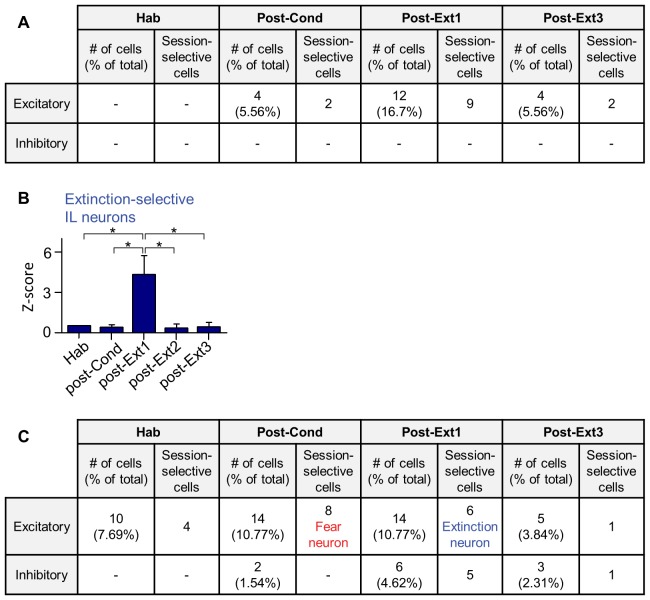
Figure 1—figure supplement 2. Cell-based analysis of single unit recordings in the IL and Ba.

Figure 1—figure supplement 2.

(A) CS-responses in IL individual neurons throughout the training period. The cell-based analysis was conducted by comparing the largest z-values of 0–400 msec following CS onset (bin size, 100 msec). The number of CS-responsive cells and the percentage of total recorded neurons are indicated. Neurons displaying CS-responses only in one particular session were indicated as session-selective cells. (B) Extinction-selective cells in the IL (post-Ext1, n = 9 cells) shown in A (χ2 = 18.19, p=0.0011, *p<0.05 for post-Ext1 vs. the other groups, Friedman test followed by Dunn’s test). These cells were included in the successful extinction recall group in Figure 1 (n = 56 cells from 14 rats). The averaged CS-response latency of IL extinction neurons was 211.1 msec, whereas Ba extinction neurons responded to the CS with much shorter latencies, averaged at 43.33 msec (U = 0.0000, p=0.0016, Mann-Whitney test). (C) CS-responses of Ba neurons throughout the training. The cell-based analysis was conducted by comparing the significance of the CS-responses within 100 msec following CS onset throughout the training period (bin size, 20 msec). Fear neurons and extinction neurons have been indicated in red and blue, respectively.