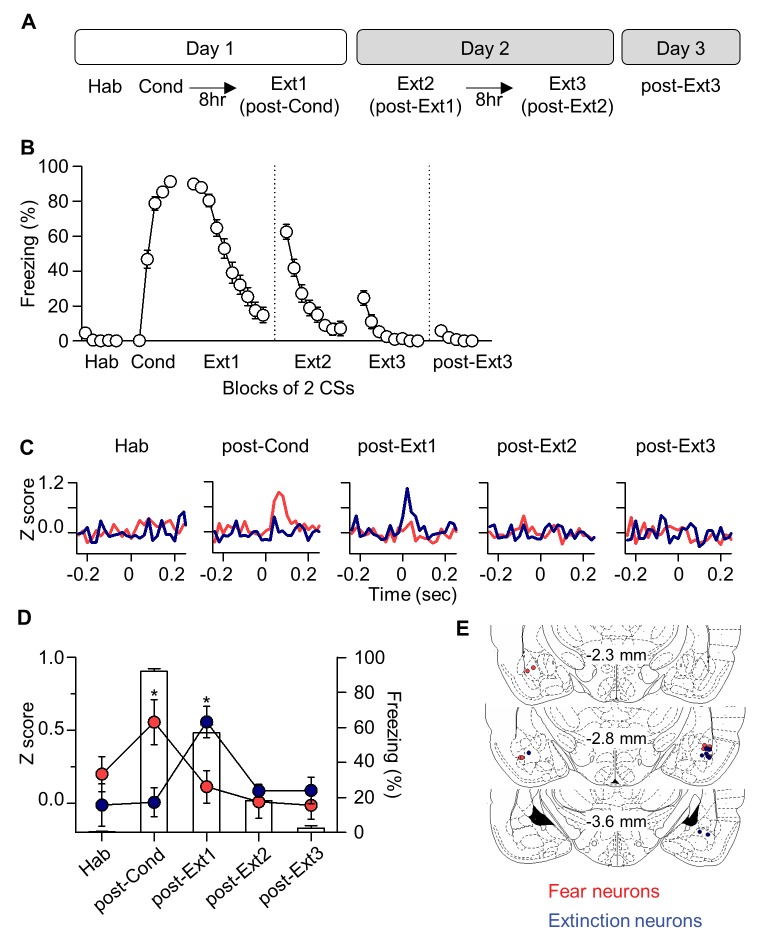
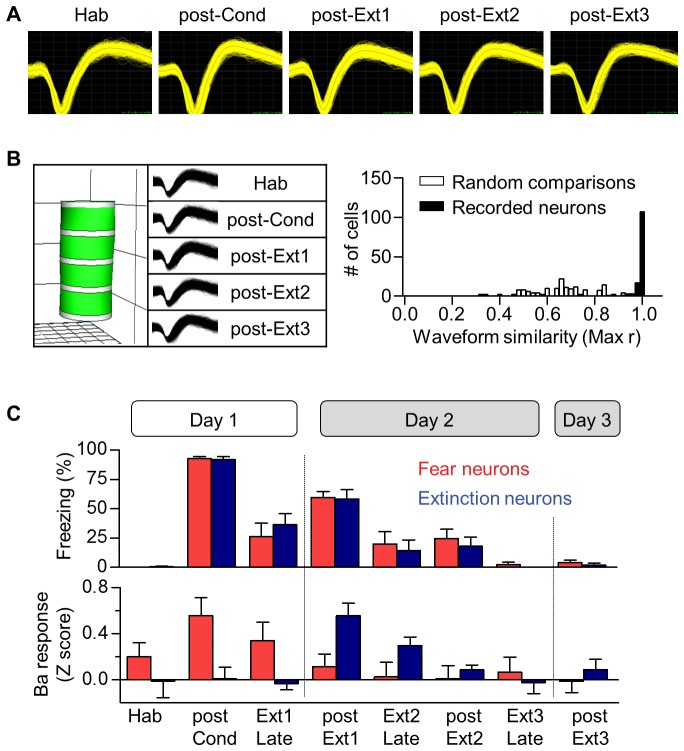
Figure 2. ‘Extinction neurons’ in the Ba, which appear after single-session extinction-training, disappear after multiple-session extinction-training.
(A) Experimental design. (B) CS-induced freezing throughout the entire behavioral training (n = 27 rats). (C) Two distinct neuronal subpopulations were identified. Fear neurons, n = 8 cells from 6 rats, red; extinction neurons, n = 6 cells from 6 rats, blue. (D) Averaged CS-evoked activities of fear and extinction neurons were plotted against freezing behavior. Friedman test revealed a significant change in neuronal and behavioral responses (Fear neurons, χ2 = 14, p=0.0073, *p<0.05 for post-Cond versus the other groups, Friedman test followed by Dunn’s test; Extinction neurons, χ2 = 10.67, p=0.0306, *p<0.05 for post-Ext1 vs. the other groups, Friedman test followed by Dunn’s test; Freezing behavior, χ2 = 39.26, p<0.0001, p<0.01 for all designated pairs except Hab vs. post-Ext3, Friedman test followed by Dunn’s test). (E) Histological verification of the electrode placements.


