
Figure 3.
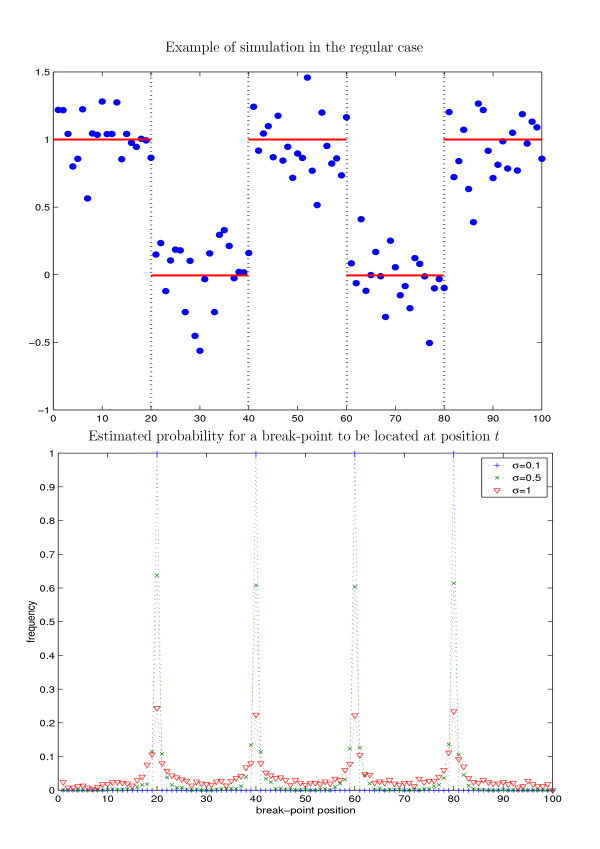
Example of a simulation in the regular case, and result of the dynamic programming algorithm for the estimation of the break-point coordinates. Top: Example of simulation for 100 data points and 5 segments in the regular case. The true break-points are designated by vertical lines, and the red lines correspond to the mean of each segment. The difference of means d is constant and equals 1. Bottom: Estimated frequency for a break-point to be located at coordinate t for t = 1 to 100. Different levels of noise are considered with σ = 0.1, σ = 0.5, σ = 1.