
Figure 3.
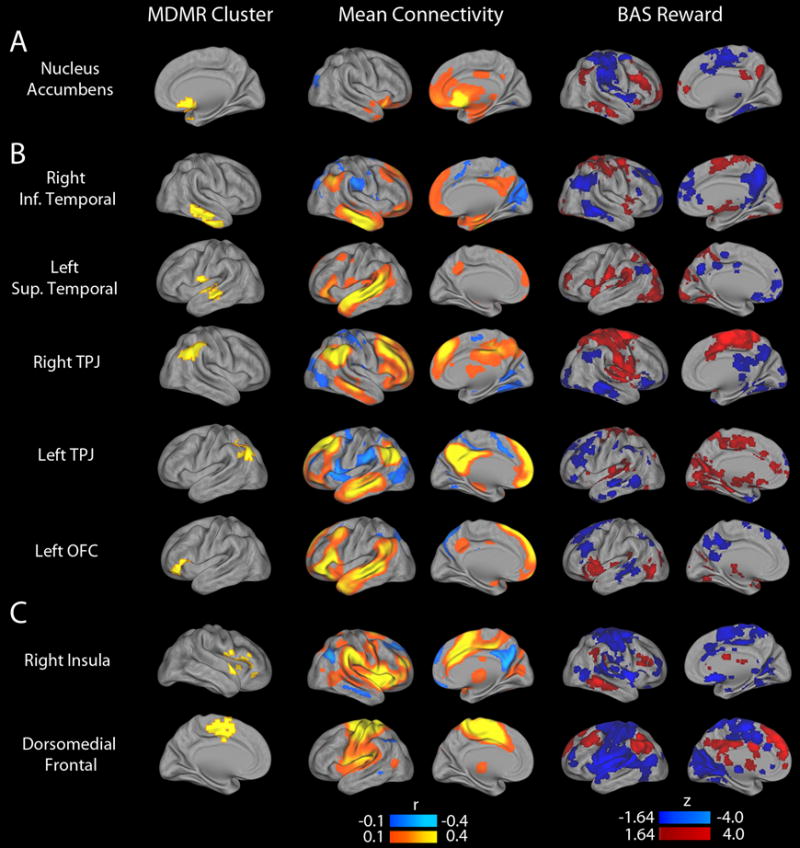
Follow-up seed-based connectivity analyses explain patterns of connectivity that drive MDMR results. The multivariate results of the connectome-wide association study (CWAS) identified the nucleus accumbens (A), default mode regions (B) and cingulo-opercular regions (C) where the overall pattern of connectivity is related to reward responsivity, but did not delineate the nature of those patterns. Accordingly, each cluster identified by CWAS (left column) was used as a seed to identify what changes in connectivity led to the significant finding. The middle column displays the mean connectivity across all subjects from each seed. The right column displays the association with BAS Reward for each seed.