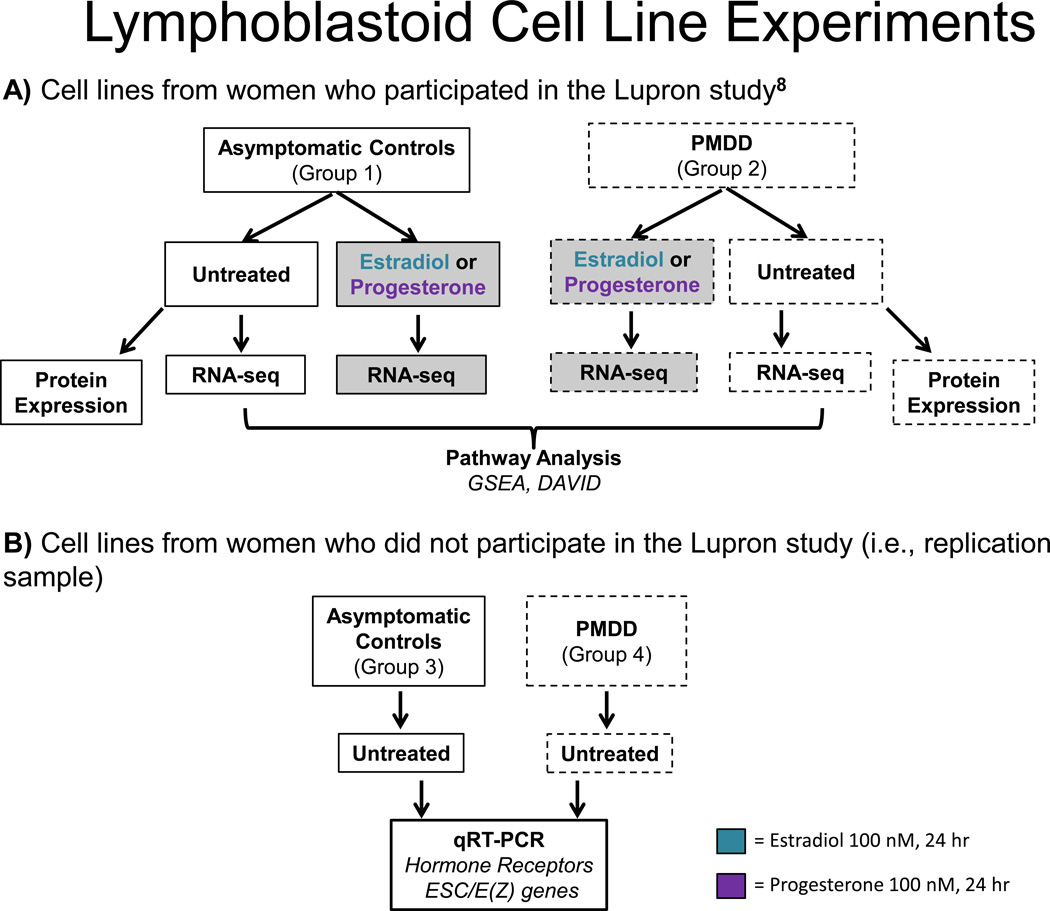
Figure 1. LCL treatments and analyses.
Flow chart of LCL experiments. Blood is collected from women with PMDD or asymptomatic Controls and transformed into LCLs with Epstein Barr virus. Cells are then left untreated or treated with hormone (estradiol or progesterone, 100 nM each) and undergo RNA-sequencing. Pathway analyses were applied to results, and selected genes from the indicated LCL groups are followed up with qRT-PCR and protein analysis via ProteinSimple©.

