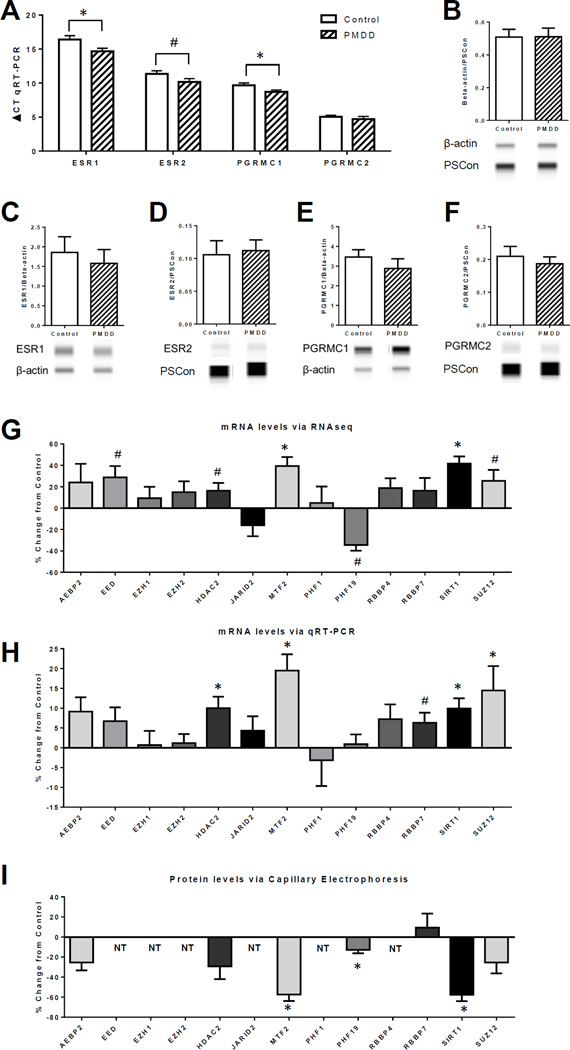
Figure 2. mRNA and protein expression for hormone receptors and ESC/E(Z) Complex genes comparing untreated Control and PMDD lymphoblastoid cell lines.
All graphs are presented as group mean ± SEM. (A–F) Student’s t-test was performed for each comparison. (A) qRT-PCR analysis of mRNA expression for hormone receptors ESR1, ESR2, PGRMC1, and PGRMC2 in lymphoblastoid cell lines (LCLs), n=15. Relative gene expression levels were calculated for ∆CT value with β-actin as the reference control for normalization; note a lower ∆CT value indicates higher expression. Both ESR1 and PGRMC1 were significantly higher in the PMDD group than the Control group (*p<0.05), and ESR2 was higher at a trend level of significance in the PMDD group than the Control group (#p<0.1). (B) Verification of β-actin as a normalizing protein for ProteinSimple© western analysis of protein expression in LCLs. The chemiluminescense ratio of β-actin over the ProteinSimple© Loading Control (PSCon) was calculated for each group and no significant difference was found (n=7, t12=0.02, p=0.9). (C–F) ProteinSimple© western analysis of protein expression for hormone receptors ESR1, ESR2, PGRMC1, and PGRMC2 (n=7). Target protein chemiluminescense was normalized to β-actin or PSCon if there was band interference with β-actin, as was the case for ESR2 and PGRMC2. There were no significant differences for any of the proteins. For (B–F), representative images of protein “bands” from the Compass software are shown below each group. (G–H) All graphs are calculated as percent change of values of the PMDD group from the Control group mean. Statistical analysis comes from Student’s t-test of the original group means (see Supplemental Figure 2). (G) Percent change from control of mRNA expression via RNAseq for the 13 genes of the ESC/E(Z) complex (n=9–10). Both MTF2 and SIRT1 were significantly higher in the PMDD group than the Control group (*p<0.05), and EED, HDAC2, and SUZ12 were higher at a trend level of significance in the PMDD group than the Control group (#p<0.1), while PHF19 was lower at a trend level of significance in the PMDD group than the control group (#p<0.1). (H) Percent change from control of mRNA expression via qRT-PCR for the 13 genes of the ESC/E(Z) complex (n=29–30). HDAC2 (t43=2.6), MTF2 (t37=3.7), SIRT1 (t46=3.2), and SUZ12 (t42=2.1) were significantly higher in the PMDD group than the Control group (*p<0.05), and RBBP7 (t33=1.8) was trending higher in the PMDD group than the Control group (#p<0.1). (I) Percent change from control of protein expression via ProteinSimple© western analysis for select genes of the ESC/E(Z) complex (n=7). NT indicates that protein was not tested. MTF2 (t11=3.4), PHF19 (t12=2.5), and SIRT1 (t11=3.2) were significantly lower in the PMDD group than the Control group (*p<0.05).

