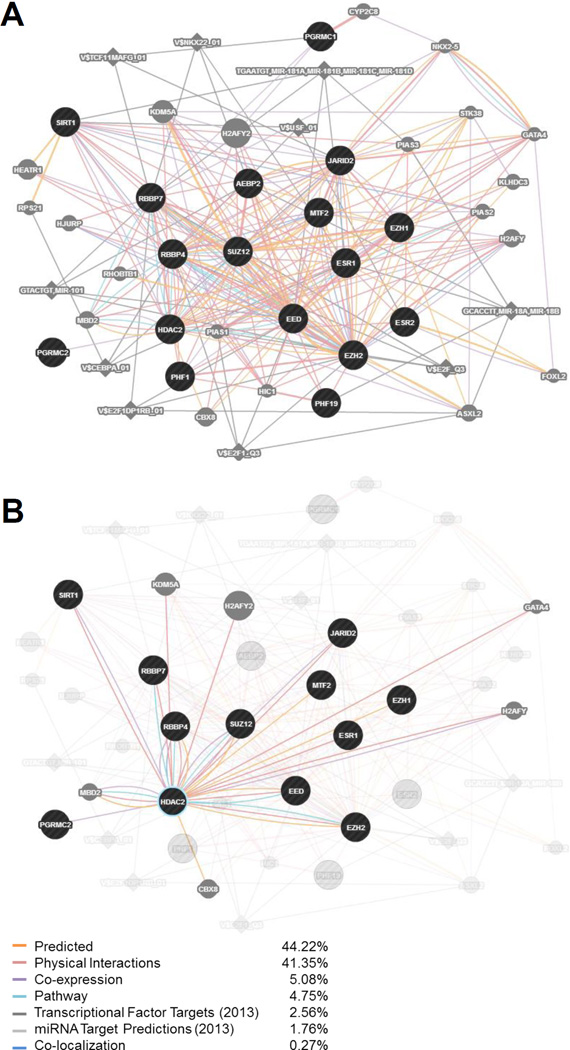
Figure 4. GeneMANIA interaction analysis of ESC/E(Z) and steroid hormone receptor genes.
GeneMANIA (genemania.org) was used to generate a gene network analysis inputting the 13 genes of the ESC/E(Z) complex (AEBP2, EED, EZH1, EZH2, HDAC2, JARID2, MTF2, PHF1, PHF19, RBBP4, RBBP7, SIRT1, SUZ12) and the 4 hormone receptor genes (ESR1, ESR2, PGRMC1, PGRMC2), whose expression was identified in LCLs. Genes and targets are included in the network for the input genes based on weights of interactions with the input genes, determined automatically by linear regression. Black circles indicate the input genes. Gray circles indicate additional genes identified in the network – a larger circle reflects a higher rank of connection with the input genes. Diamonds indicate miRNA or transcription factor targets. A thicker connecting bar between nodes reflects a stronger relationship between those two nodes. (A) The expanded network based on a search of these 17 input genes (September, 2015). The strongest relationships driving this network are Predicted Interactions (44.22% weight) and Physical Interactions (41.35% weight). (B) Selection of HDAC2 and highlighting its interactions within the predicted network. HDAC2 shows interactions with 9 of the 13 genes of the ESC/E(Z) complex (7 of them physical), as well as several other genes in the network. Importantly, it is the only component of the ESC/E(Z) complex that interacts with a receptor for both estradiol (ESR1) and progesterone (PGRMC2).

