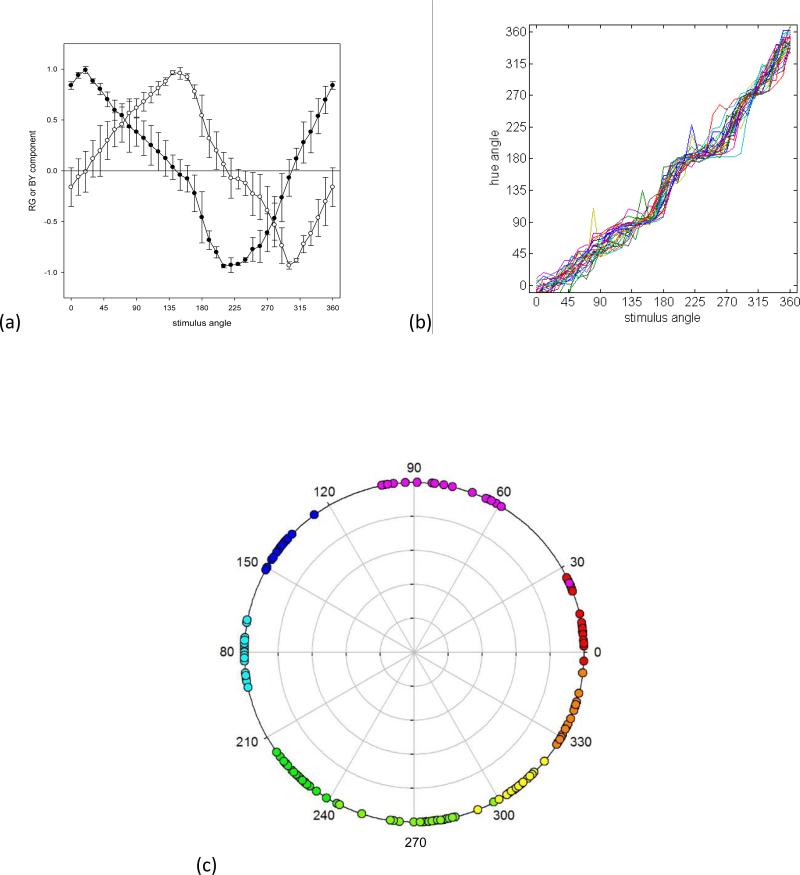
Figure 1.
a) Mean chromatic response functions estimated from the hue scaling functions for the 26 observers (new data set). Filled symbols plot the estimated chromatic response functions for red (positive) and green (negative); unfilled symbols plot the functions for blue (positive) or yellow (negative). Error bars correspond to the standard deviation of the settings across observers. b) Individual settings for the perceptual hue angles, based on converting the scaling responses to the corresponding angle in the RG vs BY perceptual space. c) Stimulus angles corresponding to the loci of unique or binary hues for each observer.

