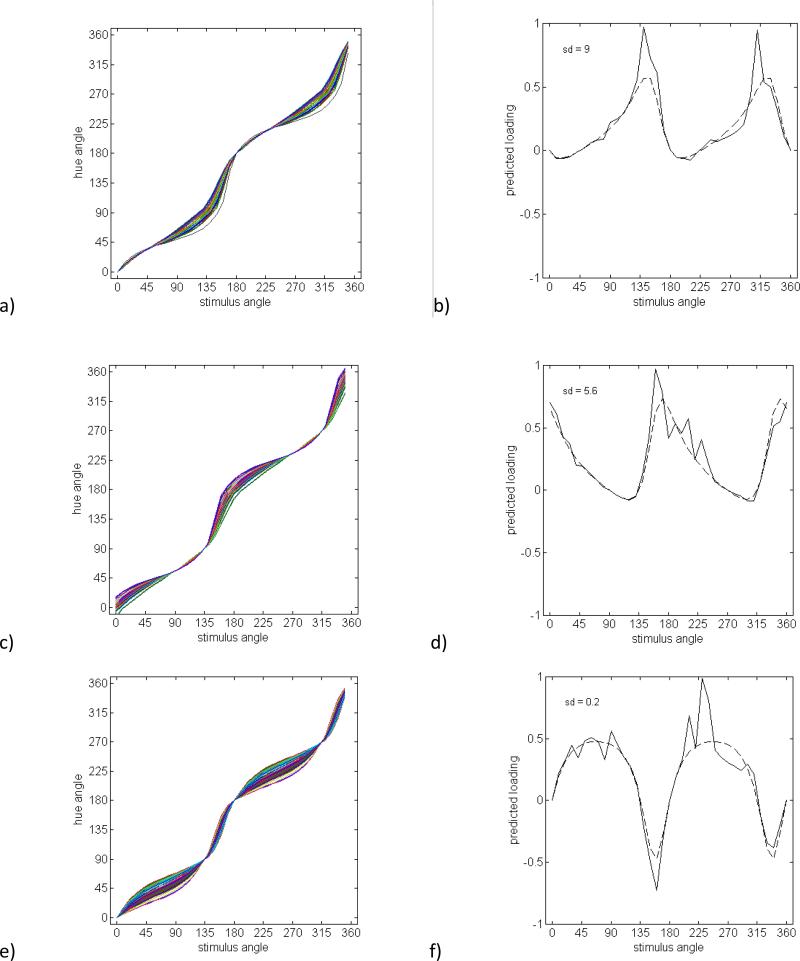
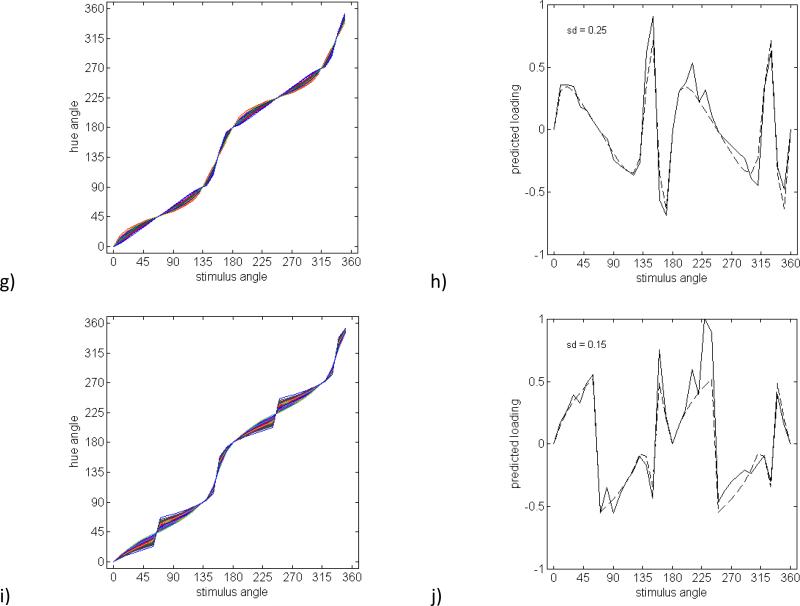
Figure 4.
Simulated hue scaling functions and individual factors with loadings predicted based on the individual standard deviations at each stimulus angle (solid lines) or a constant standard deviation equal to the average across all stimulus angles (dashed lines). a) Hue scaling functions for a group of observers differing in the locus of the red-green axis and b) a factor with loadings estimated directly from variation across observers in the locus of the red-green axis (SD = 9°). c) Hue scaling functions and d) predicted factor loadings based on variation across observers in the locus of the blue-yellow mechanism (SD = 5.6°). e) Hue scaling functions and f) factor loadings predicted for variations in the relative sensitivity of the red-green and blue-yellow mechanisms (SD = 20%). g) Hue scaling functions and h) a factor loadings predicted from varyiations in the degree of nonlinearity in the contrast response of the red-green and blue-yellow opponent mechanisms. The nonlinearity is modeled as a cosine tuning function rasied to different exponenents (SD = 0.25). i) Hue scaling functions and j) a factor loadings predicted for a group of observers differing in the magnitude of categorical bias in their responses (SD = 0.15).


