Figure 3.
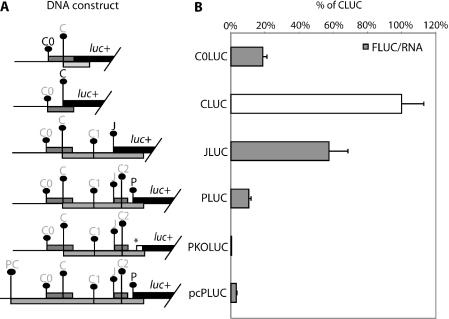
The expression levels from each respective initiation codon within the HBV pregenomic RNA. (A) A schematic diagram of the HBV test constructs used to study the levels of initiation from C0, C, J and P initiation codons. Each initiation codon is fused in-frame to the luciferase gene. The initiation codon with a darker font is in-frame to the luciferase reporter gene and an asterisk (*) indicates the position where a mutation is introduced. (B) Normalized expression level from each initiation codon as compared with that from CLUC, assigned as 100%. These results are averages from two independent experiments.

