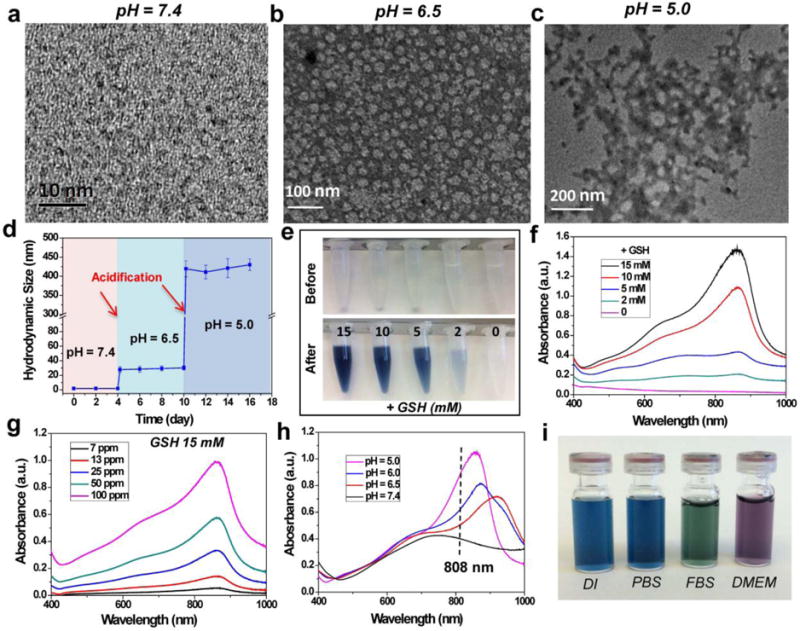
Figure 1.

Synthesis and characterization of Ox-POM. a - c) TEM images of clusters at pH = 7.4, 6.5, and 5.0. d) DLS measurements of Ox-POM clusters with successive acidifications from pH = 7.4 to pH = 6.5 and to pH = 5.0. e) Photographs of Ox-POM clusters dispersed in deionized water before and after incubation with various concentrations of GSH and f) the corresponding UV-vis spectra. g) UV-vis absorptions of Ox-POM clusters with various Mo concentrations after incubation with GSH (15 mM). h) UV−vis-NIR absorptions of Ox-POM clusters (100 ppm Mo) at various pH values after incubation with GSH (15 mM). i) Photographs of GSH-reduced Ox-POM clusters dispersed in various media.
