
Figure 4.
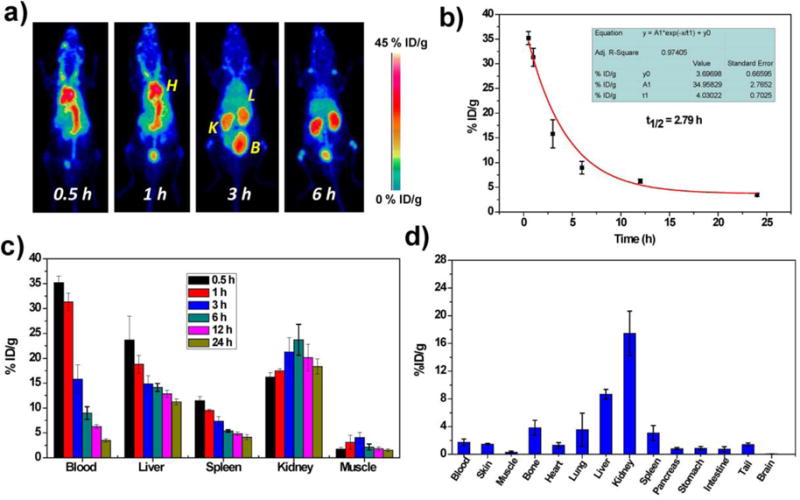
In vivo studies of Ox-POM clusters. a) Representative maximum intensity projection PET images of mice taken at various time point post intravenous injection of 89Zr-Ox-POM. H: heart; K: kidney; L: liver; B: bladder. b) Time-activity curves of 89Zr-Ox-POM in the blood (n = 3, mean ± s.d.). c) Quantification of 89Zr-Ox-POM uptake in the blood, liver, spleen, kidney, and muscle at various time points post-injection (n = 3, mean ± s.d.). d) Biodistribution of 89Zr-Ox-POM clusters at 24 h after intravenous injection into mice as determined by 89Zr radioactivity measurement in various tissues and organs (n = 3, mean ± s.d.).