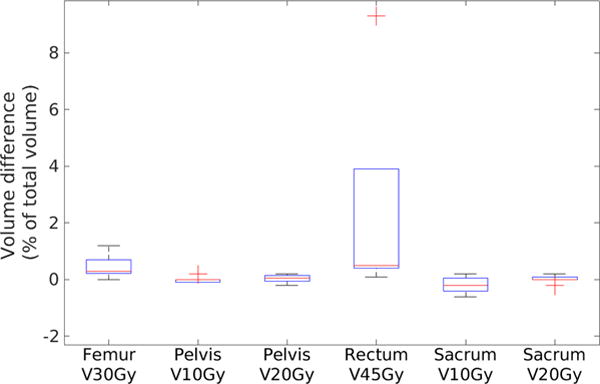
Figure 11.

Box plot of volume difference of OARs. Red line indicates the median. Bars indicate the maximum and minimum and red crosses indicate outliers. (Data points are defined as outliers if they are greater than q3 + 1.5 × (q3 − q1) or less than q3 − 1.5 × (q3 − q1), q3 and q1 are the 75th and 25th percentiles of the sample data, respectively.)
