Figure 7.

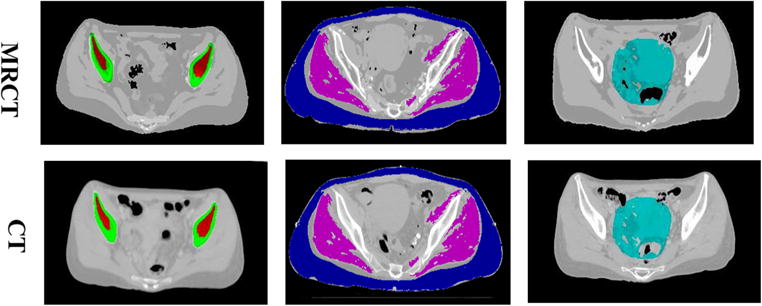
Example ROIs on MRCT (top) and CT (bottom) images. (left) ROIs for solid bone (green) and bone marrow (red). (middle) ROIs for muscle (magenta) and external fat (blue). (right) ROIs for intra-pelvic soft tissues (cyan).

Example ROIs on MRCT (top) and CT (bottom) images. (left) ROIs for solid bone (green) and bone marrow (red). (middle) ROIs for muscle (magenta) and external fat (blue). (right) ROIs for intra-pelvic soft tissues (cyan).