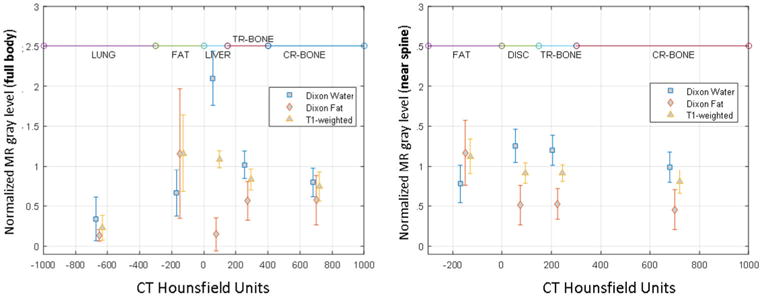
Figure 2.

Distribution of normalized MR grey levels as a function of Hounsfield units within the full body and within a region surrounding the spine with a 1 cm outer margin. These plots show significant degeneracy between bone and fat causing standard FCM classification methods to misclassify some tissue as bone. DISC = vertebral disc fluid, TR-BONE = trabecular bone, CR-BONE = cortical bone.
