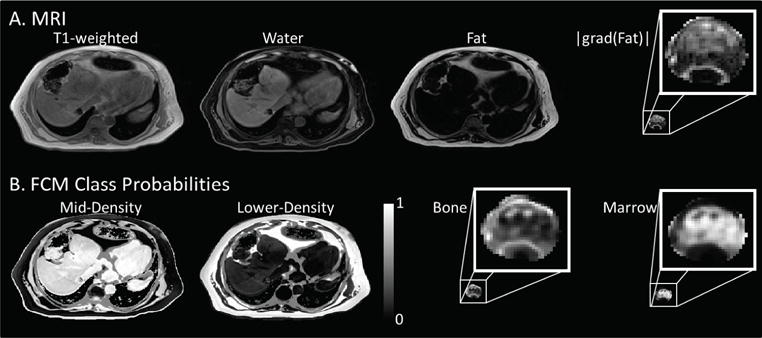
Figure 3.

The Dixon T1-weighted, water, fat, and the magnitude of the gradient of the fat image (A) were used as inputs to generate the FCM class probabilities mid-density, lower-density, bone and marrow (B). The |grad(Fat)| image was only used for classification inside the segmented bone volume. Similarly, the bone and marrow classes were constrained to exist only within the segmented volume.
