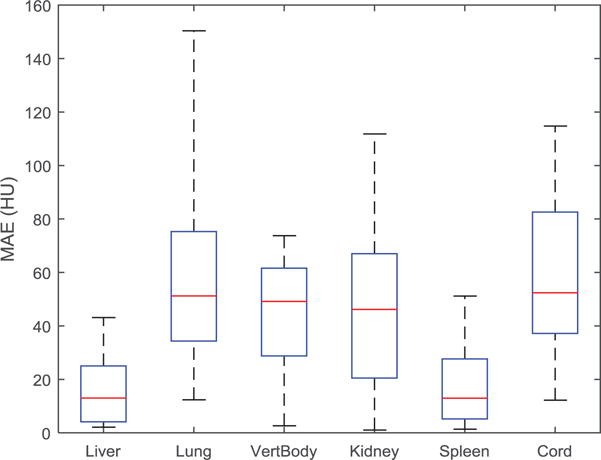
Figure 5.

Mean absolute error (MAE) between MRCT and CT HU values for manually created contours within the boundaries of various tissue types across all patients. Box and whisker plots show the median (center-line), 75% (top of box), 25% (bottom of box), max and min (dashed line).
