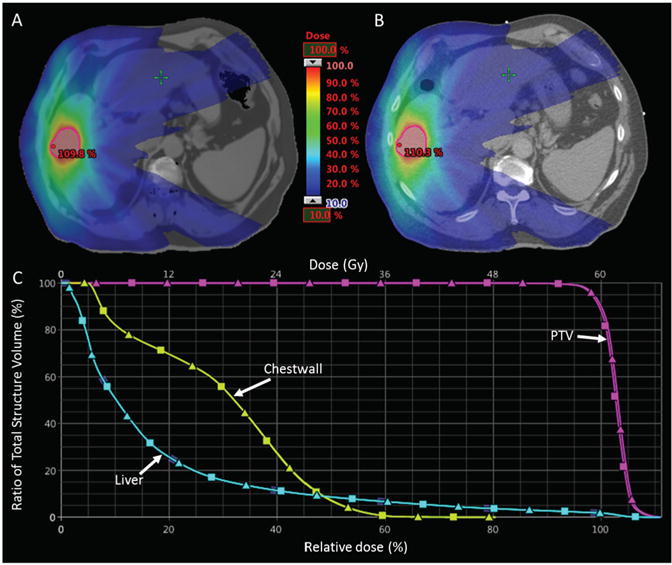
Figure 6.

Relative dose distributions optimized on MRCT (A) and recalculated on standard CT (B). The DVH curves for the PTV, Chest wall and Liver are shown in the bottom panel (C) where MRCT DVHs are represented by squares and CT DVHs are triangles. Note the close proximity of the rib relative to the target (outlined in red).
