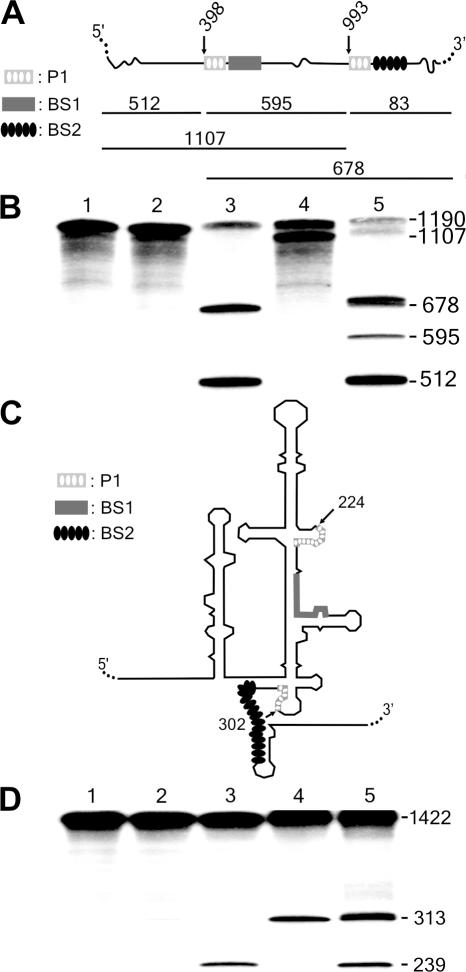
Figure 6.
Cis-cleavage analysis of various SOFA-δ ribozymes. (A and C) Schematic representation of the HBV and HCV target substrates, respectively. For these experiments, the sequence of the P1 stem is identical at each site, but the biosensor sequences are different (see the legend on the left of the Figure). (B) Autoradiogram of the cleavage assays of the 1190 nt HBV-derived target by SOFA-ribozymes cleaving at either position 398 or 993. Lane 1 is the control performed in the absence of ribozyme. Lane 2 is the reaction performed in the presence of the original δRz that cleaves at both sites (positions 398 and 993). Lanes 3 and 4 are the reactions performed with the SOFA+-δRz-398 and −993 ribozymes, respectively. Finally, lane 5 is the reaction performed in the presence of both the SOFA+-δRz-398 and -993. The reactions were performed at 37°C for 3 h. (D) Autoradiogram of the cleavage assays of a 1422 nt HCV-derived target by SOFA-δ ribozymes cleaving at either position 224 or 302 of the IRES. Lane 1 is the control performed in the absence of ribozyme. Lane 2 is the reaction performed in the presence of the original δRz that cleaves at both sites (positions 224 and 302). Lanes 3 and 4 are the reactions performed with the SOFA+-δRz-224 and -302 ribozymes, respectively. Finally, lane 5 is the reaction performed in the presence of both the SOFA+-δRz-224 and -302. The reactions were performed at 37°C for 3 h. All of the target site sequences of these substrates are presented in Supplementary Figure 1. The expected cleavage fragments are shown with their corresponding sizes in nt.

