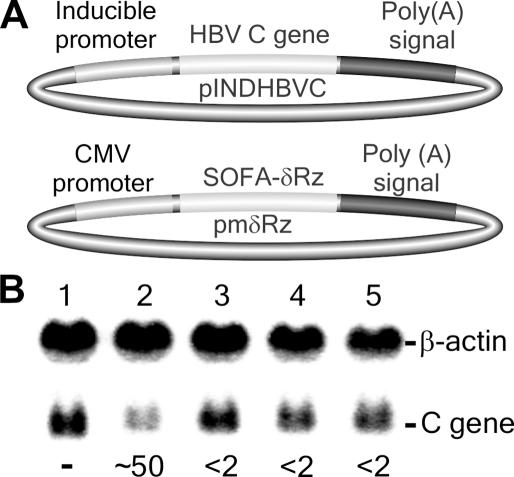
Figure 7.
Activity of SOFA-ribozymes in a cellular environment. (A) Schematic representation of the expression vectors for both the HBV C target gene (upper part) and the ribozymes (lower part). (B) Autoradiogram of northern blot hybridization. The transfection control was performed using pmδRz devoid of any ribozyme gene (lane 1). Lanes 2 and 3 are RNA samples extracted from HEK-293 EcR cultured cells expressing SOFA+-δRz-303 and SOFA+-δRzC76A-303, respectively. Lanes 3 and 4 are RNA samples extracted from cultured cells expressing SOFA−-δRz-303 and SOFA−-δRzC76A-303Rz, respectively. β-actin was used as a control for normalizing the results. The data below the autoradiogram correspond to the percentage of reduction of the C mRNA as compared with the control lane 1. Note that two independent sets of data were used to determine average values.

