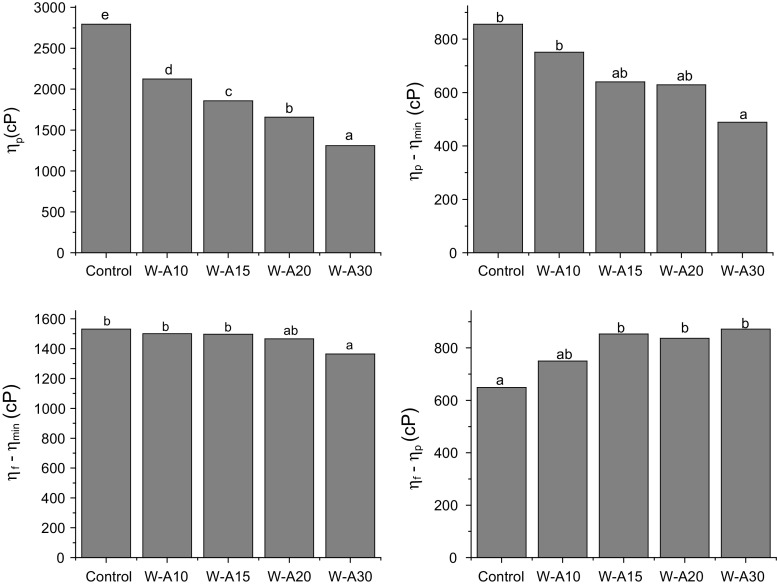
Fig. 2.
Parameters obtained from rapid visco analyzer curves: peak viscosity (ηp), breakdown (ηp-min), setback from minimum (ηf-min), setback from peak (ηf-p). Algarroba flour levels were 0% (control), 10% (W-A10), 15% (W-A15), 20% (W-A20) and 30% (W-A30). Different letters indicate significant differences among samples (p < 0.05)

