
Figure 7.
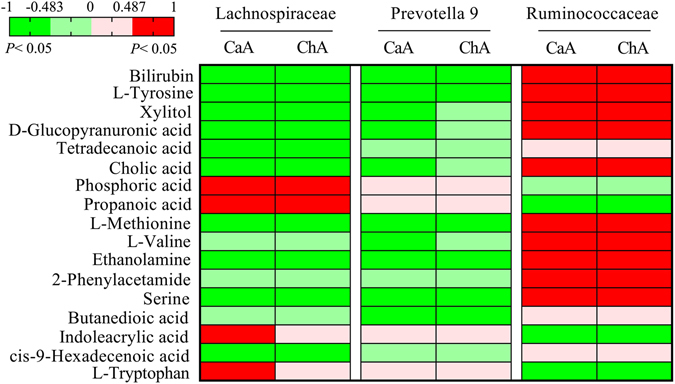
Heatmap with color gradients related to correlation coefficient between the variables. A red cell represents a significant correlation between the corresponding metabolite and microbiota component; green represents a significant anticorrelation between the variables; and other cells indicated no significant correlation. The correlation coefficients were assessed in CaA (control, DEN and DEN + CaA) and ChA (control, DEN and DEN + ChA) group, respectively.