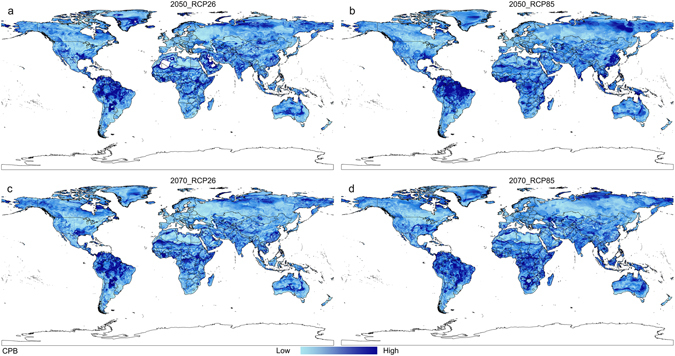
Figure 5.

Coefficient of variation (CV) maps of four global climate models (GCMS) for Colorado potato beetle which were produced by MaxEnt (v3.3.3k, http://biodiversityinformatics.amnh.org/open_source/maxent/) under future climate conditions. (a) Variance among four GCMS under 2050-RCP26; (b) variance among four GCMS under 2050-RCP85; (c) variance among four GCMS under 2070-RCP26; (d) variance among four GCMS under 2070-RCP85. High values (warmer colors areas) indicate higher uncertainty with respect to low values (colder colors areas) where different models produce similar results. The whole maps are generated by using the tool of ArcGIS 10.2.2(ESRI, Redlands, CA, USA, http://www.esri.com/).
