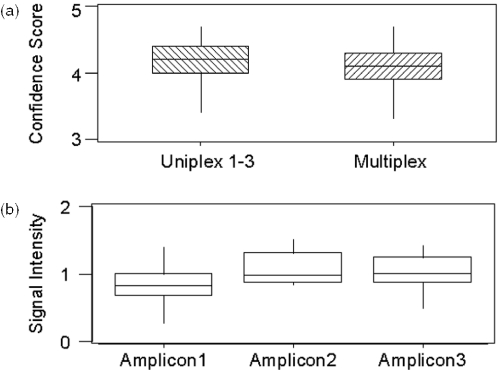
Figure 3.
Comparison of spectra quality based on (a) confidence scores in uniplex and triplex reactions and (b) signal intensities for each individual amplicon derived from the triplexed reactions. The distribution of confidence scores and signal intensities are presented as box and whisker plots. The box extends from the first to the third quartile (interquartile range). The line inside the box marks the median and the lines extending out on either side indicate the minimum and maximum values.

