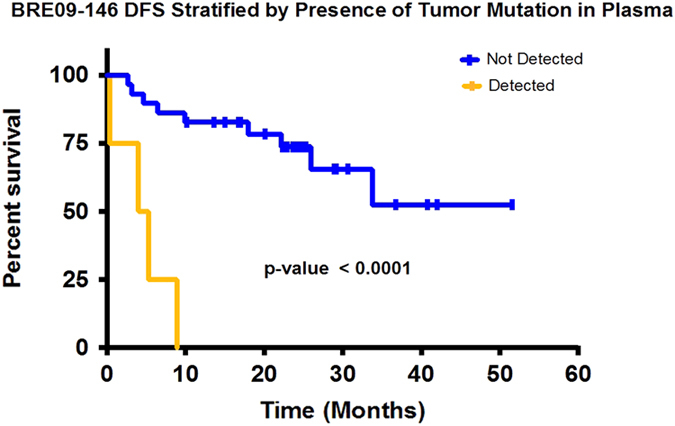
Fig. 5.

Kaplan–Meier plot: disease-free survival stratified by presence of tumor mutation in plasma. Four patients from this study who had mutation identified from plasma samples relapsed rapidly (0.3, 4.0, 5.3, and 8.9 months). The yellow line represents patients with detectable ctDNA in plasma. The blue line represents patients with no detectable ctDNA in plasma.The difference in median DFS between patients with detectable ctDNA vs. those without was statistically significant (p < 0.0001, median DFS: 4.6 mos. vs. NR; HR = 12.6, 95% CI: 3.06-52.2)
