Figure 2.
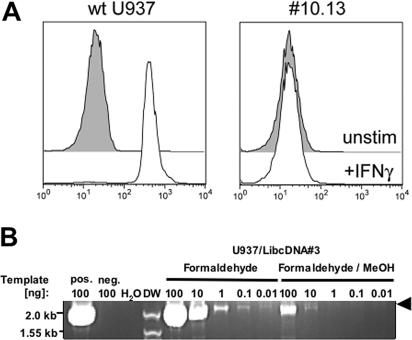
Responsiveness of selector cells and selective amplification of cDNAs. (A) FACS analysis of IFN-γ-induced Stat1 phosphorylation of wt U937 cells and cell clone #10.13. Unstimulated cells (gray histogram) or after exposure to IFN-γ (open histogram) were fixed and permeabilized and subsequently stained with antibodies raised against pSTAT1 (Y701) conjugated with Alexa 647. (B) Detection limit of the PCR used to specifically amplifying an integrated cDNA. Genomic DNA isolated from U937 cells transduced with the retroviral library clone #3 harboring a cDNA (2 kb) after formaldehyde fixation and formaldehyde/methanol treatment were used as templates for PCR yielding ∼2 kb band (arrow). DNA of transduced and untransduced non-treated cells served as positive and negative controls, respectively. DW, DNA marker.

