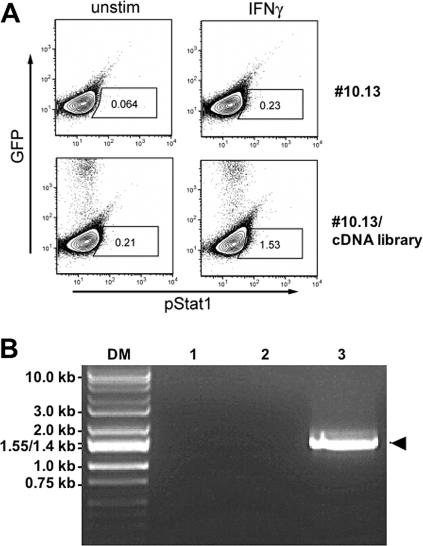
Figure 3.
Cell sorting of cDNA expressing cells and amplification of cDNA. (A) pStat1 detected in unstimulated and IFN-γ-stimulated transduced selector cells. Boxes indicate the gates used to select pStat1-positive cells. Numbers within the boxes represent the percentage of cells within the gate. (B) Specific amplification of cDNAs. No DNA fragment was amplified using no template (1) or genomic DNA of untransduced #10.13 cells (2) serving as negative controls, respectively, using the oligonucleotides LIB5′MCSforw and LIB3′cDNAS/Xrev matching the flanking regions upstream and downstream of the cDNA insertion site in the retroviral backbone. Genomic DNA of transduced cells selected by FACS for the occurrence of pStat1 after IFN-γ stimulation (3) yielded one fragment termed cDNA1.2 shown to encode the IFNGR2 (arrow). DM, DNA marker.

