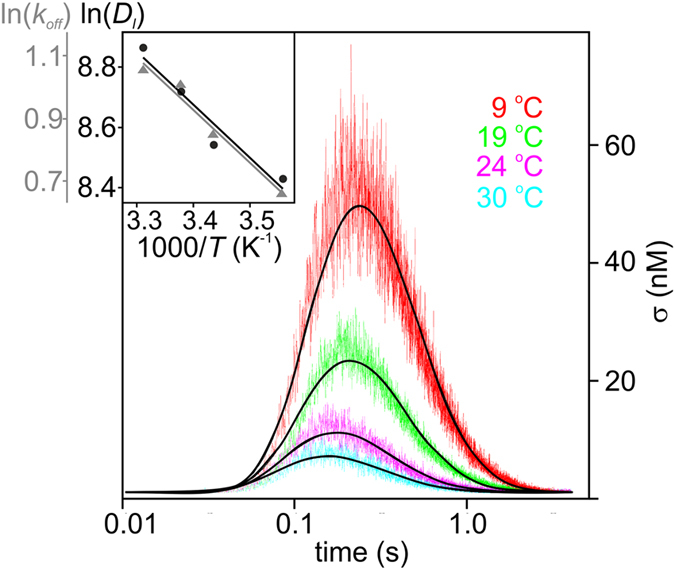
Figure 3.

Kinetics of the proton concentration adjacent to the membrane surface at 80 µm from the release spot for different temperatures. The colored traces are averaged data from at least 10 individual release events each. At least three such averaged traces had been obtained at every temperature for four distances: 80, 90, 100 and 110 µm. The global fits of the non-equilibrium model (equation (S3)) to all traces at a given temperature is depicted as solid black lines. Inset: Temperature dependencies of the rate coefficient for proton surface-to-bulk release (k off, in units of s−1) and for the lateral diffusion constant (D l, in units µm2 s−1). The slopes correspond to ΔH ‡ l ≈ 5.9 ± 1.1 k B T and ΔH ‡ r ≈ 5.7 ± 0.7 k B T, whereas the intercepts with the y-axis are A l = (3.3 ± 0.5) × 106 µm2 s−1 and A r = (8.1 ± 0.9) × 102 s−1, respectively (compare equations (7) and (9)).
